


Quick Start Tutorials
VisualTrader Tutorials
-
The Map
-
The List
-
Signals
-
Charts
-
Chart Patterns
-
Alerts
-
Trading Tools
-
Simulation
The Map
Learn how to configure the Map to show the information you want to display.
-
Opening Maps
-
Cylinder Characteristics
-
Viewing More Information
-
Map Navigation
-
Map Zooming
-
Map Rotation
-
Map Resetting
-
Creating a Map
-
Map Editing
-
Creating and Adding new Groups or Symbols
Opening Maps
Follow these instructions to open an existing Map in VisualTrader.
1. To open a Map, click File » Open. The Open Map dialog box appears with a list of VisualTrader Map (.vtp) files. The pre-designed Maps are located in the VisualTrader\Profiles subdirectory.
Open Map Dialog Box
2. Select the Map you would like to open and click Open. VisualTrader displays and populates the selected Map.
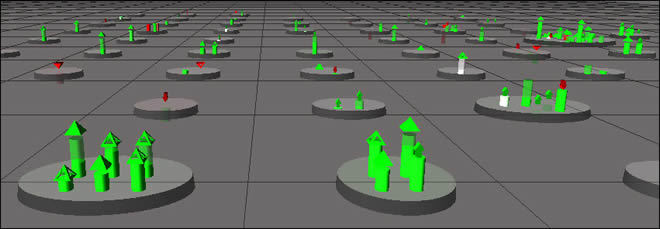
Cylinder Characteristics
A Cylinder's shape and color will change depending on various factors. The Cylinder's characteristics are illustrated in the example below.
Cylinder Characteristics
The factors that control the change in a cylinder’s characteristics are known as Measurements. The color of the plate is also controlled by a Measurement.
Viewing More Information
If you place your mouse cursor over a cylinder, you will see a display that tells you the stock it represents. You can place your mouse cursor over a plate to see which industry group it represents as well.
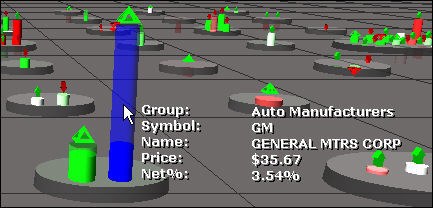
Cylinder Display Popup
Map Navigation
You can use your mouse or the arrow keys on your keyboard to move within the VisualTrader Map. To move the Map left, right, forward or back with your mouse, simply click on the Map floor and drag in the direction you want to move.
Move the Map Using Drag and Drop
This example shows how to move forward to an area of the Map by clicking and dragging the Map floor.
Map Zooming
You can zoom in or out of the Map by using the <+> or <-> keys on your keyboard. If your mouse has a scroll wheel, you can use this to zoom in or out of a Map as well.
Zoom the Map Using Plus Key
Map Rotation
You can rotate VisualTrader Maps by right-clicking on the floor, holding the mouse button down, and then dragging in the direction you wish to rotate. You can also use the keyboard to rotate your view by holding the key down and then pressing the <+> or <-> buttons on your keyboard.
Rotate the Map Using Mouse or Keyboard
Note: You can also double-click on the Map floor to have the Map automatically rotate 180 degrees.
Map Resetting
As you navigate through a VisualTrader Map, there will be times when you want to return to the default view as quickly as possible. This can be done pressing the or keys on your keyboard. You can also select Tools»Reset View from the VisualTrader menu.
Default View
Creating a Map
Follow these instructions to create a new Map in VisualTrader.
1. To create a new Map, click File » New. The New Map dialog box appears.
New Map Dialog Box
2. If you want to save the Map in a different folder, locate and open the folder.
3. In the File name field, type a name for the Map.
4. Click Save, and you will be presented with a blank Map. Once you have saved your new Map, you can make changes to the group definitions and symbols.
Map Editing
You can edit the symbol list of any existing Map in the Edit Map dialog box. Make sure that you are in the Map you wish to edit in order to access its list of symbols. Follow these instructions to edit an existing Map in VisualTrader.
1. To edit group definitions and symbols in existing Maps click Edit » Symbol List. The Edit Map dialog box appears.
Edit Map Dialog Box
2. From the Edit Map dialog box, you can add groups to the map.
Creating and Adding New Groups or Symbols
You can also add your own groups or symbols in VisualTrader. It is important to remember that you need to have the correct group highlighted before adding the symbol. From the Edit Map dialog box, complete the following steps:
1. Enter the name of the group or symbol you want to add into the Add Group or Add Symbol field. You will see it added to the list below.
Note: If you are adding a symbol to the map, first select a group from the left column. If you do not select a group from the list, VisualTrader will add the symbol to the highlighted group.
Edit Map Dialog Box
2. You can customize groups you add by adding symbols.
A quick way to add one symbol to a Map is type it into the Quick Chart field at the top of your VisualTrader Map screen. The chart will be immediately displayed for that symbol, and a cylinder for that symbol will be added to your Map on the Miscellaneous plate. If you do not already have a Miscellaneous plate on your Map, one will be automatically created for you.
The List
Learn how to use VisualTrader's List to find the hottest condidates.
-
Opportunity List
-
Viewing Opportunities
-
Viewing a Second Opportunity List
-
Sorting Opportunities
-
Visual Statistics
-
Database Statistics
-
Profile Statistics
-
Intraday Statistics
-
Timeframes Column
Opportunity List
VisualTrader provides you with a method to see the activity of hundreds of stocks at the same time. Yet with so many stocks to look at, there will be times when you want the best opportunities brought to your attention. This is the purpose of the Opportunity List. The Opportunity List gives you the ability to view securities, groups or both in a sortable manner.
Selecting the Groups button will show only the industry groups in your Map. Selecting the Symbols button will show only the securities in your Map.
Opportunity List
In this illustration, the Both button is selected, which gives a view of groups and symbols. From the Opportunity List, you can select the securities that are displayed as charts in VisualTrader.
Note: You can change the width of the Opportunity List by dragging the window to the desired size.
Viewing Opportunities
Depending on how you choose to use VisualTrader, you may want to turn off the Opportunity List from time to time. To turn the list off, select View » List. Repeating this process will turn the list back on again. You can also press to toggle the Opportunity List on and off.
Viewing A Second Opportunity List
In VisualTrader, you can display two Opportunity Lists. This allows you to prospect for both Longs and Shorts at the same time. To activate the second List, select View»Second List or use the Docking Toolbar on the left edge of VisualTrader. In the following illustration, you see that we have activated the second List. The top list is sorted on the Above column, while the bottom list is sorted on the Below column.
View with Second Opportunity List Activated
Sorting Opportunities
The columns in the Opportunity List allow you to sort by different criteria. Click on the column name, and VisualTrader will sort on that criterion. For example, if you click on the Above column, the List will be sorted by the securities that are furthest above the Map floor. We will discuss the significance of this later, but for now we need to define each of the columns in the Opportunity List.
• Symbol — This refers to the symbol of a security. It is an alphabetical sort and applies to groups as well.
• Below — Clicking on this column will bring the cylinders that are furthest below the Map floor to the top of the Opportunity List.
• Above — Sorting on this column will bring the symbols that are furthest above the Map floor to the top of the Opportunity List.
• B (Body Color) — This column will sort the Opportunity List by the brightest body color.
• R (Roof Color) — This column will sort the Opportunity List by the brightest roof color.
• S (Signal) — This column contains the signal for the corresponding symbol. There are many different types of signals. Refer to the following table for a complete description.
VisualTrader Signals
The following columns can be added to or removed from the Opportunity List by right clicking on any column header and selecting Add Column.
• Strat — This column contains the Strategy for the corresponding symbol. The Strategy name that produced the current signal (if one exists) will be displayed.
• PN (Pattern Name) — This column contains the name of the most recent pattern (if one exists) for the corresponding symbol.
• LP (Last Price) — Indicates the most recent price value for the given symbol
Visual Statistics
Visual Statistic columns will bring the visual properties of the map into view in the Opportunity List.
Available Statistics Columns are:
• Below — Sorting on this column will bring the cylinders that are furthest below the Map floor to the top of the Opportunity List.
• Above — Sorting on this column will bring the symbols that are furthest above the Map floor to the top of the Opportunity List.
• B (Body Color) — This column will sort the Opportunity List by the brightest body color.
• R (Roof Color) — This column will sort the Opportunity List by the brightest roof color.
• S (Sig) — This column contains the signal for the corresponding symbol. There are many different types of signals. Refer to the following table for a complete description.
• PD (Pattern) — Pattern direction indicated by red or green dot.
• PN (Pattern Name) — This column contains the name of the most recent pattern (if one exists) for the corresponding symbol.
• Setup (Indicator Setups) — Setups give you a quick visual indication of the technical conditions in the chart. They are fully configurable, allowing you to define the exact conditions for which you are looking.
• Comp (Leading Indicator Comp) — The Composite Leading Indicator calculates an average of all Leading Indicators in the Opportunity List for all of the timeframes in the active VisualTrader map, consolidating the information into one Leading Indicator.
• Leading Indicator — The Leading Indicator provides you with an indication of overall market sentiment, and is designed to alert you when there has been a significant sentiment shift. The Leading Indicator in the Opportunity List displays sentiment for each symbol individually for each timeframe VisualTrader is analyzing.
Database Statistics
The following database statistics columns are available for viewing ion the Opportunity List:Available Statistics Columns are:
• Close — Indicates the most recent closing price value for the given symbol.
• High — Indicates the high price for the most recent day of data.
• Low — Indicates the low price for the most recent day of data.
• Open — Indicates the open price for the most recent day of data.
• ATR (Wilder's Volatility) — Volatility measurement. Averages the difference between the high and low over a given number of bars.
• Exchange — Indicates the exchange on which the given symbol trades.
• Name — Shows the name of the symbol.
Profile Statistics
Profile Statistics refer to composite results of multiple Trading Strategies when a voting process is used. If you select one Trading Strategy from the Strategy menu, then these statistics refer to the statistics generated by that Trading Strategy only.
Some of the following statistics can have the prefix BT (back test), or FT (forward test), indicating the period of time VisualTrader is considering for that statistic.
• Strat — This column contains the Strategy for the corresponding symbol. The Strategy name that produced the current signal (if one exists) will be displayed.
• ADV (Advisor Rating) — Indicates the strength of the signal. It is based on the individual scores of the Trading Systems that contributed to the vote.
• Bars — Number of bars a signal has been active.
• NT (Number of Trades) — Shows the total number of trades for the specified period. It is the sum of NL and NS for the given time period.
• NL (Number of Longs) — Shows the total number of long signals for the given period. For example, a BTNL of 4 means that four long signals were reported on the Voting Line between the back test start and end dates.
• NS (Number of Shorts) — Indicates the total number of short signals for the symbol over the given period of time.
• HR (Hit Rate) — This column displays the hit rate for the specified time period. The hit rate is calculated using the formula 100% * (xPL + xPS)/ xNT, where x indicates BT for back test or FT for forward test.
• APR (Annualized Percent Return) — Displays the APR of the given symbol. APR is the percent return, Prof%, averaged out to a full trading year of 250 trading days.
• Prof% (Percent Profit) — The Prof% column shows the percent profit for the given symbol. It is calculated by summing the total profit in all trades over the given time period. Worded differently, it is the sum of the profits from each trade on the Voting Line. Percent profit is a base statistic for APR.
• Prof%= 100*($ Returned)/($ Invested)
For Futures:Prof% = 100%*(PINc- POUTc) * PF /(Total Margin),
where:
PINc = Price In, the close of the day VisualTrader entered the market.
POUTc = Price Out, close of the day VisualTrader exited the market.
PF = Price Factor.
Total Margin is the Total Margin for the given commodity in the Easy Data database.
Intraday Statistics
When you trade using intraday data, there are statistics that can be very helpful, which you would not use in End-of-Day trading.
You can configure your Opportunity List to include the following Intraday Statistics:
• Ask (Ask Price) — The price a market maker is asking for the security (the price you will pay if you buy).
• Bid (Bid Price) — The price a market maker is willing to pay for the security (the price you will receive if you sell).
• Last (Last Price) — The last price at which a transaction occurred.
• Net (Net Change) — The net change for the day.
• NetPct (Net Percent Change) — The net percent change for the day.
• 52 High (52 Week High) — The highest high price over the last 52 weeks.
• 52 Low (52 Week Low) — The lowest low price over the last 52 weeks.
• Ask Size — The number of shares (size of Ask).
• Bid Size — The number of shares (size of Bid).
• Prev Close — The closing price of the previous day.
Note: These statistics require realtime data.
Timeframes Column
The profiles in VisualTrader may contain up to seven different timeframes. Signals that are generated for each of the timeframes, or data periods, can be viewed in the Opportunity List by adding the column from the Timeframes menu into the Opportunity List.
To add a column that will reflect current signals for additional timeframes, right-click any column title header at the top of the Opportunity List and select Add Column followed by Timeframes. Then select the desired column to add. All newly added columns appear as the right-most column in the Opportunity List.
Note: Timeframe columns must exist in the profile & be enabled to vote under Edit » Timeframes.
Signals
Use VT's advanced Trading Signals to pinpoint prime movers.
-
Running VisualTrader's Analysis
-
VisualTrader Strategies
-
Performing Real Time Analysis
-
Performing End Of Day Analysis
Running VisualTrader's Analysis
VisualTrader’s first and most important goal is to automate the market analysis and trading process as much as possible. You can set which strategies and test settings VisualTrader will use in your charts from the Strategies and Test Settings tabs on the Edit Strategy Settings dialog box. To open the this dialog box, select Edit » Strategies.
VisualTrader Edit Strategy Settings Dialog Box
The Opportunity List is the window of information that shows the results of VisualTrader’s analysis for each symbol in your profile. Each time you make a change to the settings in the Edit Strategy Settings dialog box or when you update data, VisualTrader will perform the necessary analysis for your changes and display the results in the Opportunity List.
VisualTrader also displays the following indicators in the status bar at the bottom of your screen to give you statistics on VisualTrader’s analysis.
• A — Specifies the percentage of all analysis VisualTrader has completed on the collected data.
• S — Specifies the average time in milliseconds that it has taken VisualTrader to generate signals for each symbol.
• P — Specifies the average time in milliseconds that it has taken VisualTrader to complete pattern analysis on each symbol.
• Q — Specifies the number of symbols VisualTrader has yet to analyze.
VisualTrader Analysis Status Bar
VisualTrader Strategies
Strategies are activated individually using the [...] button to the right of the Strategy name in the menu above your Opportunity List. All Strategies is the default selection. The following VisualTrader Strategies come standard with VisualTrader:
• VT Gap — This Strategy identifies gaps confirmed by strong volatility breakouts. It identifies strong gaps in the market.
Breakout Strategy Applied to Applied Materials
Signal Generator (Trading System) — GAP-B (Gap Breakout), non-optimized
Dynamic Filter — Volatility Breakout Indicator, non-optimized
• VT Breakout — This Strategy looks for volatility breakout signals in the direction of the prevailing trend by confirming against an Exponential Moving Average. It identifies strong breakouts in the prevailing direction of trend.
VisualTrader Analysis Status Bar
Signal Generator (Trading System) — VTY-B (Volatility Breakout), non-optimized
Dynamic Filter — Exponential Moving Average, non-optimized
• VT Trending — This Strategy looks for trending moves identified by Random Walk confirmed by BULL-Power and BEAR-Power indicators. This is a good general purpose strategy in that it will tend to fire signals on strong new moves in the direction of the prevailing trend. It identifies and confirms key reversals within the prevailing trend.
Trending Strategy Applied to Ben-Franklin
Signal Generator (Trading System)—RWI-B (Random Walk Breakout), non-optimized
Dynamic Filter—BULL Power and BEAR Power above zero.
Performing Real Time Analysis
In Real Time Profiles, the data collection, portfolio updates, and testing run continuously. When VisualTrader loads a Real Time Profile, the Real Time Process runs one time through all the symbols in the Opportunity List. As it reaches each one, it contacts the data provider and requests historical bars based on the Data Periods dialog box settings. As data arrives, VisualTrader analyzes it and generates signals in Real Time.
Normally, a Real Time Profile initiates the Real Time process by itself as long as you are already connected to the Internet. When you load a Real Time Profile, it automatically begins the process of analysis and signal generation. When Real Time is running, the miniature-moving chart appears in the lower left corner of the display.
Real Time Process in the Status Bar
To stop the Real Time Process for any reason, click on the moving chart, which will change to a solid red bar (indicating the Real Time process is temporarily disabled). Click the bar again to restart the process.
Performing End Of Day Analysis
In End-of-Day Profiles, the data collection, portfolio updates, and testing run each time VisualTrader recognizes a change which would require updates to the analysis results. If you are using OmniData and you want the analysis to occur at more regular intervals, you can select Edit»Data Settings and modify the data settings.
Data Settings Dialog Box
Select Automatically download EOD data to set VisualTrader to automatically update data each time it is available from your data vendor. Select Update EOD quotes every x minutes to specify that VisualTrader gather data at the specified time interval.
Charts
VT includes a wide selection of chart tools. Learn how to use them in this tutorial.
-
Charting Symbols
-
Charting Groups
-
Charting all Symbols in a Group
-
Plotting Charts on Multiple Monitors
-
Chart Options Chart Tab
-
Changing Chart Colors
-
Plotting Indicators
-
Plotting Trading Systems
-
Displaying Statistics
-
Adding Line Studies
-
Editing the Properties of a Selected Drawing Tool
-
Creating a Chart Layout
Charting Symbols
Symbols are represented as cylinders in VisualTrader. Clicking on a cylinder will immediately bring up a chart for the security it represents. You can also chart a symbol by clicking on it in the Opportunity List.
You can remove a chart from your screen either by clicking on the “X” at the top, right-hand corner of the chart window, or simply by pressing the on your keyboard.
Charting Symbols Example
The chart for FWRD was brought up by placing the mouse over this stock's Cylinder and clicking once.Another quick way to chart a symbol is to type it into the Quick Chart field and press on your keyboard. A chart is immediately displayed, and the symbol is highlighted in the list. If you do not already have that symbol in your current Map, a cylinder will be added to the Miscellaneous Group plate.
Charting Groups
The plates in VisualTrader usually represent industry groups, with the components of that group (security cylinders) resting on the plate. Clicking on the plate will bring up a chart for that industry group. This chart is a composite representation of all of the stocks on that plate.
Composite Representation of All Stocks on the Plate
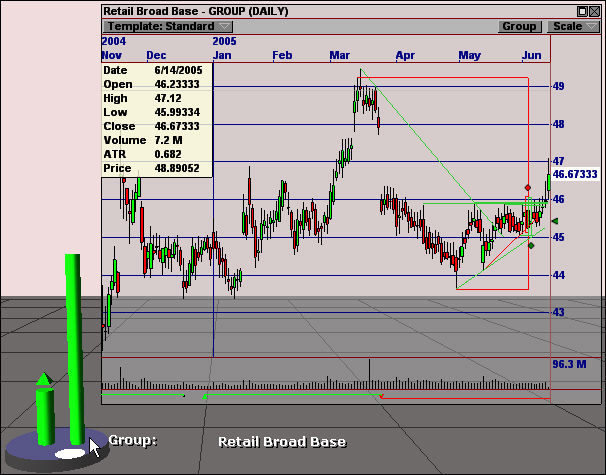
You can also view the composite group chart of a symbol by clicking the Group button in the Chart Toolbar. For example, let’s say that you have a chart for Walmart (WMT) displayed. By clicking on Group button, you will immediately see the composite chart of the Retail Broad Base industry group displayed.
Charting All Symbols In A Group
VisualTrader gives you the ability to view a chart for all the stocks in an Industry Group simply by holding down the key and then clicking on the plate of the Industry Group. You can also chart all of the symbols in a group by holding down your key and then clicking on the group in your Opportunity List.
Chart of All Symbols in the Gold Group
Plotting Charts On Multiple Monitors
You may view more charts in VisualTrader when you are using multiple monitors.
To plot charts on multiple monitors follow these instructions:
1. Right-click any symbol in the Opportunity List.
2. Select Plot » Floating Chart. A floating chart will appear in the VisualTrader window.
3. Click in the title bar of the chart and hold the mouse button down while dragging the chart to the desired monitor.
4. Close the charts using the X at the top right corner of the chart. The Window » Close All Charts function will not close floating charts.
Chart Options Chart Tab
Chart Options Dialog Box
The Chart tab contains the following options:
• Chart Style — Select from Auto, Bar, Candle, or Line.
• Font — Sets the font, font style, and font size for your charts.
• Price Scale Left — Displays the price scale on the left of the chart. The default is to have the price scale on the right of the chart.
• Display Grid — Plots a price grid on your charts.
• Mark the Backtest Period — Shows the data range that is used for back testing, as defined on the Test Settings tab of the Edit Strategy Settings. The back test period is represented by a dashed line around the back test data set.
Open Map Dialog Box
Changing Chart Colors
On the Colors tab you can change the color of various chart features. To create multiple custom Color Schemes, save your changes as a new template.
Chart Options Dialog Box
Plotting Indicators
VisualTrader contains over 80 of the most popular Technical Analysis indicators.
Chart Options Dialog Box
To add an indicator to your charts, click the checkbox in the Enable column next to the indicator name or right-click in the chart and select Add Indicator. You can disable the indicator in the Chart Options dialog box, or you can right-click on it and select Delete. You can also click on an indicator to highlight it and then press the key on your keyboard. For more information on the indicators in VisualTrader, please refer to the Indicators and Systems Help File. You can access this file by selecting Help » Indicators and Systems in VisualTrader.
Plotting Trading Systems
You can plot Trading Systems on your charts by enabling them on the Systems tab. The system will remain plotted until you deselect it or click the All Off button.
Chart Options Systems Tab
The systems are plotted with the default parameters. Once you have added it to your charts, you can change the parameters and line styles of a system by double-clicking on it's name or by clicking on the Edit button in the Chart Options dialog box. If you want to change the default parameter values, you can either type in the desired system values or use the scroll bar to adjust the parameters.
For more information on the systems in VisualTrader, please refer to the Indicators and Systems Help File. You can access this file by selecting Help » Indicators and Systems in VisualTrader.
Displaying Statistics
VisualTrader allows you to display various chart statistics, such as Symbol, Exchange, Open Price, Close Price, Volume, etc., at the top of the chart.
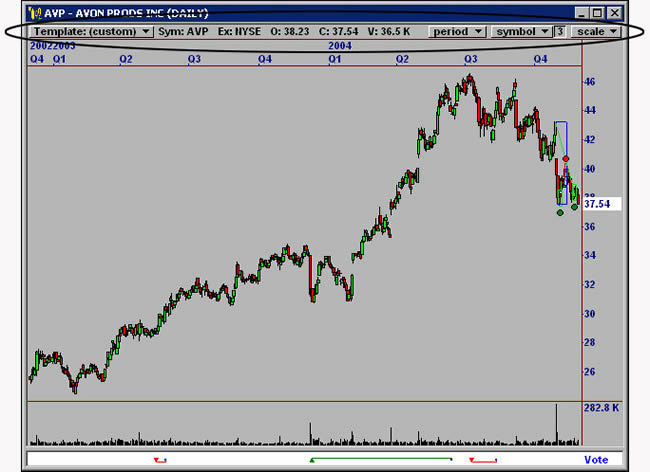
Statistics Displayed in Chart Toolbar
To access the statistics, complete the following steps:
1. Select Edit » Chart Options.
2. Select the Statistics tab.
Chart Options Statistics Tab for the Trending Template
Click in the drop-down menu next to each Statistics Field to select the statistics you want to display on your charts. Remember that this setting, like all Chart Options settings, is template specific.
Adding Line Studies
The chart tools menu gives you the ability to draw line studies on your VisualTrader charts. You can draw Trendlines, Support and Resistance Lines, the Rule of Eighth’s Lines, and Fibonacci Retracements.
By right-clicking on a chart in VisualTrader, you are presented with a menu of Charting Tools.
Charting Tools Right-click Menu
• Draw Support/Resistance Line — Draws a horizontal support/resistance line that will continue to the right edge of the chart.
• Draw Trendline Segment — Draws a trendline with no extension
• Draw Trendline Ray — Draws a trendline that extends in one direction.
• Draw Trendline (Full line) — Draws a trendline that extends in two directions.
• Trendline with Alerts — Draws a trendline and lets you configure an alert for the trendline.
• Draw Rule of Eighth's — Draws either the Rule of Eighth's lines on the chart. The Rule of Eighth's option divides a drawn line into eight equal segments, using the Rule of Eighth's trade management tool. For more information, refer to the Profiting with Chart Patterns seminar by Ed Downs.
• Draw Fibonacci Retracement — The draw Fibonacci Retracement option plots the 38%, 50%, and 62% retracement levels from user-defined peak and valley levels.
• Add Text — Allows you to annotate the chart.
• Add Signal — Plots a signal and user-defined exits. Exits can be selected and edited by double-clicking on a plotted signal.
• Properties — Allows user to edit line styles of selected line.You can also select a drawing tool or delete all of the drawings on your chart by right-clicking on the chart and using the menu that appears.
Editing The Properties Of A Selected Drawing Tool
There are two methods for accessing the line properties of each drawing tool:
• Right-click on the drawing tool once it's drawn on the chart and select Properties.
• Double-click the drawing on the chart to load the properties window.The Drawing Tool Properties dialog box will appear on the chart.There are two methods for accessing the line properties of each drawing tool:
• Right-click on the drawing tool once it's drawn on the chart and select Properties.
• Double-click the drawing on the chart to load the properties window.The Drawing Tool Properties dialog box will appear on the chart.
Drawing Tool Properties Dialog Box
• Color — Changes the color of the line study on the chart.
• Width — Controls the width of the line in the chart.
• Alert Line — Allows user to set the line as an active alert.
• Show Line Across All Timeframes — Enabling this option will allow the line study to be plotted across all timeframes that are available in the profile.
• OK — Saves the changes made to any of the properties.
• Cancel — Cancels any changes that were made to the property settings.
• Apply — Click this option to save and apply any changes made to the properties.
• Set as Default — Saves the edited properties to be applied each time the edited study is drawn on a chart.
Creating A Chart Layout
To create a Layout page, right-click on the Charts Form in the bottom right of your VisualTrader screen and select Add Layout. You will see the New Layout dialog box where you can name the new layout.
New Layout Dialog Box
The display on the screen now has four boxes. These boxes are referred to as Panes, and they serve as placeholders for charts. You can have as many or as few Panes in your Layout as you want. To create additional Panes, click on the outer edge of an existing Pane and, holding your mouse button down, drag away from the edge. You will see a new Pane appear almost immediately. You can also reduce the number of Panes by dragging the inner border of a Pane towards an outer edge.
The Initial Layout Screen with Four Panes
Chart Patterns
Learn how to use VT's advanced Chart Pattern Recognition to identify prime pattern setups.
-
Viewing Patterns in the Chart
-
Editing Pattern Settings
Viewing Patterns In The Chart
To activate the Patterns feature, select View » Patterns Feature or use the Docking Toolbar at the bottom of the window in VisualTrader. The Patterns button allows you to add chart pattern confirmation to your trading. Chart patterns help you determine whether or not a confirming pattern occurs with a given signal in the Opportunity List.
Use the buttons 1 - 5 to set the strength of the patterns you would like displayed on the chart. Selecting 1 will allow all the patterns found to be displayed in the chart. Setting the strength to 5 will only allow the best patterns found to be displayed. The Off button will remove all patterns from the chart.
Patterns Feature
You can also access the Patterns feature by selecting Edit » Patterns in VisualTrader.
Editing Pattern Settings
Click the Patterns button to launch the Edit Pattern Settings dialog box. From the Edit Pattern Settings dialog box, you can add the following assistants: Trend Lines, Support and Resistance Lines, Fibonacci Retracements, Candles, Assistant Tags, Pivot Points, Fibonacci Indicators, and Forming Patterns.
1. Click the Patterns button.
Edit Pattern Settings Dialog Box
2. Make your pattern selections in the dialog box.
3. Click Close to submit your selections and display them immediately in the chart.
The Edit Pattern Settings dialog box contains the following options:
• Short, Medium, and/or Long — Specifies the term for each pattern. A short-term pattern occurs from 1-16 bars. A medium-term pattern falls between 17-32 bars, and a long-term pattern occurs at 33 bars or greater. For Support & Resistance and Trendlines, the term is determined by the pivot points that the pattern uses.
• None or All — Specifies whether VisualTrader will display Candle patterns.
• Focus List & Charts Display Tolerance — Specifies the number of bars tolerance to use when displaying forming patterns.
• Display Forming Patterns — Displays patterns that are beginning to form at the right edge of the chart.
• Assistant Display Settings — Specifies whether VisualTrader will display Assistant Tags. The Assistant Text Color option determines the color of the tag text. When you mouse over a tag in a chart, the Pattern Recognition Module displays the name of the pattern in the color you specify.
• Pivot Points — Specifies whether to find pivot points that reinforce the short, medium, or long-terms used in VisualTrader.
• Fibonacci Indicators — Specifies whether to display Short, Medium, or Long-term retracements on the right side of the chart. Fibonacci Retracements indicate reversal points on a price chart using ratios computed from Fibonacci numbers.
Alerts
Learn how VT brings the trades to you using Signal, Pattern, and Indicator Alerts.
-
Signal Alerts
-
Signal Alert Options
-
Chart Tool Alerts
-
Fired Alerts
-
Resetting an Alert
-
Using the Position Summary Window
Signal Alerts
You can add alerts for symbols based on current signals or patterns from the chart using the Add Alert feature in VisualTrader.
Add Alert Dialog Box
To add a signal or pattern alert to a symbol in the Opportunity List, complete the following steps:
1. Click a symbol in the Opportunity List to open the chart.
2. Right-click in the chart and select Add Alert from the right-click menu. VisualTrader will display the Edit Alert dialog box.
3. Select the appropriate statistic from the Item drop-down menu.
4. Specify any changes you would like in the window. See next topic for option descriptions.
5. Click Save to enable the alert. The symbol will be added to the Active Alert List.
Signal Alert Options
The following Signal Alert options are available in VisualTrader.

Add Alert Dialog box
Signal Items:
• New Signal— Alert for one symbol that fires when a new signal is formed on the current bar. After firing, this alert is no longer active unless the Always Active option is enabled.
• Any New Signal—Fires alert when a new signal is formed on the current bar for every symbol in your Opportunity List. This alert remains active until cancelled by the user.
• New Pattern— Alert for one symbol that fires when a new pattern is formed on the current bar. After firing, this alert is no longer active.
• Any New Pattern—Fires alert when a new pattern is formed on the current bar for every symbol in your Opportunity List. This alert remains active until cancelled by the user.
Signal Alert Type specifies the type of signal to fire an alert on. The signal type options are:
• Pending
• Entry
• Reinforced
• Pending Exit
• ExitSignal Alert Direction allows you to specify signal direction.
•Long
• Short
• BothAlways Active is only available with the New Signal Alert. If enabled the New Signal Alert will remain active for the symbol after it has been fired.
Play Sound enables an audible alert. Specify your own .wav file to play by clicking the ellipsis button.
Show Message Box with Symbol displays a message window when the alert fires.
Select Day or GTC. Good Till Cancelled (GTC) means that the alert will remain active until you cancel it yourself. Day means that the alert will expire at the end of the day.
Set Defaults allows you to save the specified options for the next alert.
Chart Tool Alerts
The chart tools can be accessed from the right-click menu in any chart. From there you may choose to draw Trendlines, Support and Resistance Lines, and the Rule of Eights tool with an alert attached to it. When one of these alert tools is selected from the right-click menu and placed on the chart, the symbol will automatically appear in the Active Alert List. The Alerts box will display the symbol with a red or green background according to where it is drawn on the chart.
Fired Alerts
Once price has penetrated an alert line or a signal alert has fired, the symbol will be shown in the Fired Alert List, where it will flash to let you know that an alert has been fired. VisualTrader will also give you an audible notification of the alert firing.
In the example below, NXTL moved through the Support Line, triggering an alert. Notice how the symbol moved from the Active Alert List to the Fired Alert List.
NXTL Moves to the Fired Alert List Once the Support Line is Penetrated
To review a chart on the Fired Alert List, Active Alert List, or Watch List, just click on the corresponding symbol in the list.
Note: The chart tools menu allows you to draw Trendlines, Support and Resistance Lines the Rule of Eighth’s line, and Fibonacci Retracements. You can also apply alerts to Trendlines, Support & Resistance Lines, and the Rule of Eighth's line. After you apply a line study to your chart, right-click on the chart and select Set as Alert Line to have VisualTrader automatically alert you once price has penetrated that line.
Resetting An Alert
You have the ability to reset an alert in VisualTrader once it has been fired. Click on the line, which is associated with the alert, and move it slightly. Once you release your mouse button, the alert will be reset. Signal alerts do not have this functionality.
To illustrate this process, we have reset the alert for NXTL from the previous example. Notice how the symbol has moved back to the Active Alerts List from the Fired Alerts List.
Adjusting the Alert Line Resets the Alert for NXTL
Using The Position Summary Window
The buttons at the top of the Position Summary Window allow for different views and quick close buttons in case you want to get out of all your positions quickly.
• Open — View your open positions.
• Closed — View your closed positions.
• All — View all your open and closed positions.
• CL — Close all your open long positions.
• CS — Close all your open short positions.
• CA — Close all your open positions.
Trading Tools
Learn how to place trades in the charts and how to use VT's advanced trading tools.
-
Entering a Position
-
Closing a Position
-
How Trade Plans Work
-
Activating Trade Plans
-
Trade Plan Template
-
Position Summary Window
-
Using the Position Summary Window
Entering A Position
You can place an order to buy or sell a security by dragging and dropping the Chevron on the right edge of the VisualTrader Chart. When you use the trading chevron to enter a position, the position is entered for the currently displayed security or the security that has focus, if there are multiple symbols plotted.
With the chart of the security displayed, drag the trading chevron into place on the chart.
Once you release the chevron, OmniTrader plots the stops that are defined for Step 1 of the Trade Plan, and the Trade Plan interface is displayed.

Trade Plan Setup for a Long Position
Closing A Position
Once you have submitted a position, you may want to close the position. You can close a position in many ways, but one of the easiest is to use the Trading Chevron in the chart.
1. In the Focus List, double-click on the symbol for the security that has the position you want to close. This will display the chart for the selected security.
2. Right-click the Chevron and select Close Position. VisualTrader will immediately record the position as closed
You can also close a single position or all the positions in an account from the Open Positions tab in the Portfolio window.
1. Click on the Accounts button on the Brokerage Toolbar.
2. From the drop-down menu, select the account that contains the position you would like to close.
3. Click on the Open Positions tab.
4. Click to highlight the position that you want to close, and click the Close Position button. You will see the Close Position dialog box.
5. Confirm that the details are correct and click OK to immediately close the selected position.
Note: You can also close all the positions in the selected account by right-clicking and selecting Close All Positions and then confirming the closure. In this case, the position is not immediately closed but is submitted for closure.
How Trade Plans Work
Trade Plans use a step-by-step process to manage a trade. Each step contains conditions that define what to do if that condition is met. The following flow chart illustrates this process for a hypothetical Trade Plan:
Flow Chart of the Trade Plan Process
When the Trade Plan moves to a new step, the conditions from the previous step are no longer active. A Trade Plan can have a single step (sell/cover 100% of the initial order) or multiple steps.VisualTrader looks for the initial order to be resolved in the Trade Plan. It also checks all of the conditions and orders to make sure that they are valid. If it finds a conflict, the conflicting area is highlighted in orange. You will need to resolve the problem before you will be able to save the Trade Plan.
Activating Trade Plans
You can activate a Trade Plan by dragging and dropping the Trading Chevron found in the top right corner of your chart.
Trade Plan Order Entry Chevron
Once you release the chevron, VisualTrader plots the stops that are defined for Step 1 of the Trade Plan, and the Trade Plan Setup dialog box is displayed.
Trade Plan Setup Dialog Box with Initial Stops Displayed
Trade Plan Template
Trade Plan Templates are designed to emulate a particular type of trade management. Each Trade Plan template has its own configuration for managing the trade. When you select a template, VisualTrader loads the template settings. Once a Trade Plan template is applied to a security, the Trade Plan is no longer associated with the original template. This means that any changes you make in the Trade Plan will not be made in the template and vice versa. The following Trade Plan templates are provided:
• Default — Uses a simple Fixed Loss Stop (2 ATR’s) and a Trailing Profit Stop (1.5 ATR’s) to manage a trade.
• Eighth’s Stop — Uses a Fixed Loss Stop (3 ATR’s) as a protective stop and an Eighth’s Tool Stop (1.5 ATR’s) as a profit stop.
• Eighth’s Stop-Partial Exit — Uses a Fixed Loss Stop (3 ATR’s) as a protective stop and exits half the trade once price hits a Fixed Profit Stop (1.5 ATR’s). This Trade Plan manages the remaining half of the trade with a 1.5 ATR Eighth’s Stop.
• Long Term Trending — Uses a Fixed Loss Stop (3 ATR’s) as a protective stop and a Trailing Profit Stop (Threshold = 4 ATR’s, Cushion = 3 ATR’s) as a profit stop. It will also activate a Break Even Stop (1.5 ATR’s) once price exceeds 2 ATR’s to the gain side.
• Medium Term Trending — Uses a Fixed Loss Stop of 3 ATR’s as a protective stop and a Trailing Profit Stop (Threshold = 3 ATR’s, Cushion = 2 ATR’s) as a profit stop.
• Partial Exit — Uses a Fixed Loss Stop (2 ATR’s) as a protective stop, and it will exit 50% of the initial position if price hits a Fixed Profit Stop of 2 ATR’s. The remainder of the trade is managed with a Trailing Profit Stop (Threshold = 2 ATR’s, Cushion = 2 ATR’s).
• Short Term Trending — Uses a Fixed Loss Stop (2 ATR’s) as a protective stop, and a Trailing Profit Stop (Threshold = 2 ATR’s, Cushion = 1.5 ATR’s) as a profit stop.
Position Summary Window
The Position Summary window shows position information for the active account at a glance.
Position Summary Window
• Symbol — Symbol that is in trade.
• D — Type of position (long/short)
• Shares — Number of shares traded for a symbol
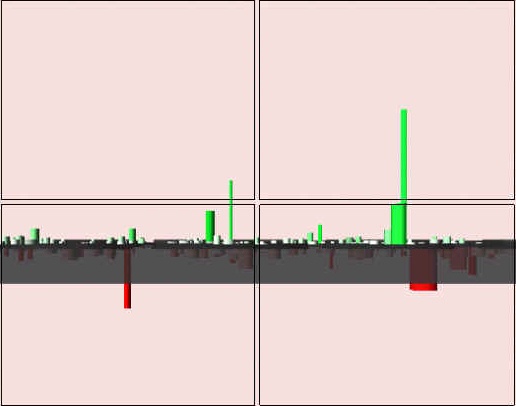
• Gain% — Percentage gained or lost for the active trade.
• Prices — Tick marks in the list represent a percentage unit in price movement - not position gains/losses. if the exact same number of shares is traded, they will line up.
• Gain$ — Gain or loss dollars for an active trade.
Using The Position Summary Window
The buttons at the top of the Position Summary Window allow for different views and quick close buttons in case you want to get out of all your positions quickly.
• Open — View your open positions.
• Closed — View your closed positions.
• All — View all your open and closed positions.
• CL — Close all your open long positions.
• CS — Close all your open short positions.
• CA — Close all your open positions.
Simulation
Learn the software in accelerated play before you take on the real market.
-
Running a Simulation
-
Trading in Simulation Mode
-
Simulation Mode Options
-
Activating the Playback Feature
-
Running the Playback Feature
-
Viewing Momentum Shifts
Running A Simulation
A Trading Simulation session can be run using any existing VisualTrader Map that has data collected. You should open the VisualTrader Map you would like to use for the Simulation and make sure the correct settings are enabled prior to running it. Simulation Mode is accessed from the Playback tool in VisualTrader.
Follow the instructions below to run a Simulation.
1. Open the VisualTrader Map you would like to use for the Simulation.
2. Set the Timeframe, Strategies and Patterns you will be using.
3. Click View » Playback Feature to bring the tool onto the Map.
4. Click the Simulator button found on the Playback tool.
Playback Tool
5. The Start Simulator Dialogue box will appear asking if you would like to Start a new Simulation Session or Continue an Existing Simulation Session. Make your selection and click OK.
Start Simulator Dialogue Box
6. The Simulator is loaded and is indicated by the data feed connection status turning red in the VisualTrader Map indicating that it is disconnected from the feed. The Simulator button will blink and the Brokerage Toolbar will change to read Simulation Mode.
The time frame that was selected when entering Simulation Mode will become the Primary Data Period and will remain highlighted until Simulation Mode has been exited. You may switch to other time frames while in a Simulation, but the advancing of data is disabled while viewing data periods other than the Primary Data Period. In order to access the Next, Pause, and Play buttons you will need to return to the Primary Data Period.
VisualTrader Map with Simulation Mode Active
7. Set the speed to Fast, Medium or High and position the Playback Start Flag on the slider bar.
8. Press Play to begin the Simulation and the start date will appear to the left of the Simulator button.
The Pause button will temporarily stop the simulation and the Next button can be used to advance the Map by one bar while paused. Pressing Play will resume the Simulation. Stop will end the Simulation and return the Map to the current date/time.
9. End the Simulation by clicking the Simulator button again. A prompt will appear asking you to confirm exiting the Simulator.
Simulation Exit Dialogue Box
Trading In Simulation Mode
Trading with the Simulator is fun and easy. There is no limit to the number of positions that can be taken in Simulation Mode and VisualTrader will manage them automatically using Trade Plans.
1. View the Map and Opportunity List to find good candidates.
2. Click a symbol in the Map or List to bring load a chart and drag the Chevron onto the chart to open a simulated position.
3. The Trade Plan window will appear allowing you to select the Trade Plan you want VisualTrader to use to manage the trade.
4. Enter the Quantity and click the Submit button.
5. The open position will appear in the Position Summary window at the bottom of VisualTrader.
6. Positions can be monitored in the Simulation Mode portfolio account. Click the Accounts button on your Brokerage Toolbar to access the portfolio.
Simulation Mode Options
Simulation Mode options are found by clicking Tools » Options » Playback.
Simulation Mode Option Dialog Box
Enabling this option will allow completed bars (future data) to be visible in other time frames. This option handles how the current bar is displayed when switching to other data periods that isn't the Primary Data Period. With the option unchecked (the default selection), higher time frame bars will not be displayed in charts until the Primary Data Period has caught up to completed bar of the higher time frame. With the option enabled you are able to view higher time frame completed bars which can lead to cheating.
For example, with the option enabled, your primary data period is set to 5 minutes, viewing the 1:30PM bar and you then switch to the 15 minute time frame, the 1:30 bar now shows the completed 15 minute bar. If the option is disabled, viewing the 15 minute data period will show the last completed bar (1:15pm).
Activating The Playback Feature
To activate the Playback Feature, click on View » Playback Feature. The Playback Feature will appear at the bottom of your VisualTrader screen.
When using the Playback Feature, you can have the current playback date indicated on charts in one of two ways. You can have a red vertical line illustrating the date, or you can have the chart adjust so that the playback date is the last bar on the chart. To specify which option you would like, right-click on Playback Feature Control and select your desired preference.
Running The Playback Feature
There are a few different ways to run the playback. You can grab the green slider and scroll back and forward to different moments in time to see how the Map looked at that particular instant. You can also use the arrows on each side of the scroll bar to move back and forward one bar at a time.
The most commonly used method of playback is to use the Playback Start Flag. Position this flag where you would like the playback to begin, and then each time that you click the Play button, the playback will automatically start at that point and run to the current bar.
Playback Start Flag
Viewing Momentum Shifts
When you engage the Playback Feature, you can see the momentum shifts from one industry group to another. The Playback Feature not only shows you the state of the market at particular time, but it also displays the shift in the strength and weaknesses of industry groups. By letting the Playback Feature “play” over the latest bars of data, you will see certain groups gain momentum, helping you to confirm the direction of the group as well as the market as a whole.
Another use of the playback tool is to see the type of candidates that each Transform will present for you. We recommend that you use the Playback Feature to actually see how each Transform reacts to market data. This will help you in deciding which Transform best suits your trading style.
Playback Feature
Quick Start Tutorials
-
The Map
The Map
Learn how to configure the Map to show the information you want to display.
-
Opening Maps
-
Cylinder Characteristics
-
Viewing More Information
-
Map Navigation
-
Map Zooming
-
Map Rotation
-
Map Resetting
-
Creating a Map
-
Map Editing
-
Creating and Adding new Groups or Symbols
Opening Maps
Follow these instructions to open an existing Map in VisualTrader.
1. To open a Map, click File » Open. The Open Map dialog box appears with a list of VisualTrader Map (.vtp) files. The pre-designed Maps are located in the VisualTrader\Profiles subdirectory.
Open Map Dialog Box
2. Select the Map you would like to open and click Open. VisualTrader displays and populates the selected Map.
Cylinder Characteristics
A Cylinder's shape and color will change depending on various factors. The Cylinder's characteristics are illustrated in the example below.
Cylinder Characteristics
The factors that control the change in a cylinder’s characteristics are known as Measurements. The color of the plate is also controlled by a Measurement.
Viewing More Information
If you place your mouse cursor over a cylinder, you will see a display that tells you the stock it represents. You can place your mouse cursor over a plate to see which industry group it represents as well.
Cylinder Display Popup
Map Navigation
You can use your mouse or the arrow keys on your keyboard to move within the VisualTrader Map. To move the Map left, right, forward or back with your mouse, simply click on the Map floor and drag in the direction you want to move.
Move the Map Using Drag and Drop
This example shows how to move forward to an area of the Map by clicking and dragging the Map floor.
Map Zooming
You can zoom in or out of the Map by using the <+> or <-> keys on your keyboard. If your mouse has a scroll wheel, you can use this to zoom in or out of a Map as well.
Zoom the Map Using Plus Key
Map Rotation
You can rotate VisualTrader Maps by right-clicking on the floor, holding the mouse button down, and then dragging in the direction you wish to rotate. You can also use the keyboard to rotate your view by holding the key down and then pressing the <+> or <-> buttons on your keyboard.
Rotate the Map Using Mouse or Keyboard
Note: You can also double-click on the Map floor to have the Map automatically rotate 180 degrees.
Map Resetting
As you navigate through a VisualTrader Map, there will be times when you want to return to the default view as quickly as possible. This can be done pressing the or keys on your keyboard. You can also select Tools»Reset View from the VisualTrader menu.
Default View
Creating a Map
Follow these instructions to create a new Map in VisualTrader.
1. To create a new Map, click File » New. The New Map dialog box appears.
New Map Dialog Box
2. If you want to save the Map in a different folder, locate and open the folder.
3. In the File name field, type a name for the Map.
4. Click Save, and you will be presented with a blank Map. Once you have saved your new Map, you can make changes to the group definitions and symbols.
Map Editing
You can edit the symbol list of any existing Map in the Edit Map dialog box. Make sure that you are in the Map you wish to edit in order to access its list of symbols. Follow these instructions to edit an existing Map in VisualTrader.
1. To edit group definitions and symbols in existing Maps click Edit » Symbol List. The Edit Map dialog box appears.
Edit Map Dialog Box
2. From the Edit Map dialog box, you can add groups to the map.
Creating and Adding New Groups or Symbols
You can also add your own groups or symbols in VisualTrader. It is important to remember that you need to have the correct group highlighted before adding the symbol. From the Edit Map dialog box, complete the following steps:
1. Enter the name of the group or symbol you want to add into the Add Group or Add Symbol field. You will see it added to the list below.
Note: If you are adding a symbol to the map, first select a group from the left column. If you do not select a group from the list, VisualTrader will add the symbol to the highlighted group.
Edit Map Dialog Box
2. You can customize groups you add by adding symbols.
A quick way to add one symbol to a Map is type it into the Quick Chart field at the top of your VisualTrader Map screen. The chart will be immediately displayed for that symbol, and a cylinder for that symbol will be added to your Map on the Miscellaneous plate. If you do not already have a Miscellaneous plate on your Map, one will be automatically created for you.
-
The List
The List
Learn how to use VisualTrader's List to find the hottest condidates.
-
Opportunity List
-
Viewing Opportunities
-
Viewing a Second Opportunity List
-
Sorting Opportunities
-
Visual Statistics
-
Database Statistics
-
Profile Statistics
-
Intraday Statistics
-
Timeframes Column
Opportunity List
VisualTrader provides you with a method to see the activity of hundreds of stocks at the same time. Yet with so many stocks to look at, there will be times when you want the best opportunities brought to your attention. This is the purpose of the Opportunity List. The Opportunity List gives you the ability to view securities, groups or both in a sortable manner.
Selecting the Groups button will show only the industry groups in your Map. Selecting the Symbols button will show only the securities in your Map.
Opportunity List
In this illustration, the Both button is selected, which gives a view of groups and symbols. From the Opportunity List, you can select the securities that are displayed as charts in VisualTrader.
Note: You can change the width of the Opportunity List by dragging the window to the desired size.
Viewing Opportunities
Depending on how you choose to use VisualTrader, you may want to turn off the Opportunity List from time to time. To turn the list off, select View » List. Repeating this process will turn the list back on again. You can also press to toggle the Opportunity List on and off.
Viewing A Second Opportunity List
In VisualTrader, you can display two Opportunity Lists. This allows you to prospect for both Longs and Shorts at the same time. To activate the second List, select View»Second List or use the Docking Toolbar on the left edge of VisualTrader. In the following illustration, you see that we have activated the second List. The top list is sorted on the Above column, while the bottom list is sorted on the Below column.
View with Second Opportunity List Activated
Sorting Opportunities
The columns in the Opportunity List allow you to sort by different criteria. Click on the column name, and VisualTrader will sort on that criterion. For example, if you click on the Above column, the List will be sorted by the securities that are furthest above the Map floor. We will discuss the significance of this later, but for now we need to define each of the columns in the Opportunity List.
• Symbol — This refers to the symbol of a security. It is an alphabetical sort and applies to groups as well.
• Below — Clicking on this column will bring the cylinders that are furthest below the Map floor to the top of the Opportunity List.
• Above — Sorting on this column will bring the symbols that are furthest above the Map floor to the top of the Opportunity List.
• B (Body Color) — This column will sort the Opportunity List by the brightest body color.
• R (Roof Color) — This column will sort the Opportunity List by the brightest roof color.
• S (Signal) — This column contains the signal for the corresponding symbol. There are many different types of signals. Refer to the following table for a complete description.
VisualTrader Signals
The following columns can be added to or removed from the Opportunity List by right clicking on any column header and selecting Add Column.
• Strat — This column contains the Strategy for the corresponding symbol. The Strategy name that produced the current signal (if one exists) will be displayed.
• PN (Pattern Name) — This column contains the name of the most recent pattern (if one exists) for the corresponding symbol.
• LP (Last Price) — Indicates the most recent price value for the given symbol
Visual Statistics
Visual Statistic columns will bring the visual properties of the map into view in the Opportunity List.
Available Statistics Columns are:
• Below — Sorting on this column will bring the cylinders that are furthest below the Map floor to the top of the Opportunity List.
• Above — Sorting on this column will bring the symbols that are furthest above the Map floor to the top of the Opportunity List.
• B (Body Color) — This column will sort the Opportunity List by the brightest body color.
• R (Roof Color) — This column will sort the Opportunity List by the brightest roof color.
• S (Sig) — This column contains the signal for the corresponding symbol. There are many different types of signals. Refer to the following table for a complete description.
• PD (Pattern) — Pattern direction indicated by red or green dot.
• PN (Pattern Name) — This column contains the name of the most recent pattern (if one exists) for the corresponding symbol.
• Setup (Indicator Setups) — Setups give you a quick visual indication of the technical conditions in the chart. They are fully configurable, allowing you to define the exact conditions for which you are looking.
• Comp (Leading Indicator Comp) — The Composite Leading Indicator calculates an average of all Leading Indicators in the Opportunity List for all of the timeframes in the active VisualTrader map, consolidating the information into one Leading Indicator.
• Leading Indicator — The Leading Indicator provides you with an indication of overall market sentiment, and is designed to alert you when there has been a significant sentiment shift. The Leading Indicator in the Opportunity List displays sentiment for each symbol individually for each timeframe VisualTrader is analyzing.
Database Statistics
The following database statistics columns are available for viewing ion the Opportunity List:Available Statistics Columns are:
• Close — Indicates the most recent closing price value for the given symbol.
• High — Indicates the high price for the most recent day of data.
• Low — Indicates the low price for the most recent day of data.
• Open — Indicates the open price for the most recent day of data.
• ATR (Wilder's Volatility) — Volatility measurement. Averages the difference between the high and low over a given number of bars.
• Exchange — Indicates the exchange on which the given symbol trades.
• Name — Shows the name of the symbol.
Profile Statistics
Profile Statistics refer to composite results of multiple Trading Strategies when a voting process is used. If you select one Trading Strategy from the Strategy menu, then these statistics refer to the statistics generated by that Trading Strategy only.
Some of the following statistics can have the prefix BT (back test), or FT (forward test), indicating the period of time VisualTrader is considering for that statistic.
• Strat — This column contains the Strategy for the corresponding symbol. The Strategy name that produced the current signal (if one exists) will be displayed.
• ADV (Advisor Rating) — Indicates the strength of the signal. It is based on the individual scores of the Trading Systems that contributed to the vote.
• Bars — Number of bars a signal has been active.
• NT (Number of Trades) — Shows the total number of trades for the specified period. It is the sum of NL and NS for the given time period.
• NL (Number of Longs) — Shows the total number of long signals for the given period. For example, a BTNL of 4 means that four long signals were reported on the Voting Line between the back test start and end dates.
• NS (Number of Shorts) — Indicates the total number of short signals for the symbol over the given period of time.
• HR (Hit Rate) — This column displays the hit rate for the specified time period. The hit rate is calculated using the formula 100% * (xPL + xPS)/ xNT, where x indicates BT for back test or FT for forward test.
• APR (Annualized Percent Return) — Displays the APR of the given symbol. APR is the percent return, Prof%, averaged out to a full trading year of 250 trading days.
• Prof% (Percent Profit) — The Prof% column shows the percent profit for the given symbol. It is calculated by summing the total profit in all trades over the given time period. Worded differently, it is the sum of the profits from each trade on the Voting Line. Percent profit is a base statistic for APR.
• Prof%= 100*($ Returned)/($ Invested)
For Futures:Prof% = 100%*(PINc- POUTc) * PF /(Total Margin),
where:
PINc = Price In, the close of the day VisualTrader entered the market.
POUTc = Price Out, close of the day VisualTrader exited the market.
PF = Price Factor.
Total Margin is the Total Margin for the given commodity in the Easy Data database.
Intraday Statistics
When you trade using intraday data, there are statistics that can be very helpful, which you would not use in End-of-Day trading.
You can configure your Opportunity List to include the following Intraday Statistics:
• Ask (Ask Price) — The price a market maker is asking for the security (the price you will pay if you buy).
• Bid (Bid Price) — The price a market maker is willing to pay for the security (the price you will receive if you sell).
• Last (Last Price) — The last price at which a transaction occurred.
• Net (Net Change) — The net change for the day.
• NetPct (Net Percent Change) — The net percent change for the day.
• 52 High (52 Week High) — The highest high price over the last 52 weeks.
• 52 Low (52 Week Low) — The lowest low price over the last 52 weeks.
• Ask Size — The number of shares (size of Ask).
• Bid Size — The number of shares (size of Bid).
• Prev Close — The closing price of the previous day.
Note: These statistics require realtime data.
Timeframes Column
The profiles in VisualTrader may contain up to seven different timeframes. Signals that are generated for each of the timeframes, or data periods, can be viewed in the Opportunity List by adding the column from the Timeframes menu into the Opportunity List.
To add a column that will reflect current signals for additional timeframes, right-click any column title header at the top of the Opportunity List and select Add Column followed by Timeframes. Then select the desired column to add. All newly added columns appear as the right-most column in the Opportunity List.
Note: Timeframe columns must exist in the profile & be enabled to vote under Edit » Timeframes.
-
Signals
Signals
Use VT's advanced Trading Signals to pinpoint prime movers.
-
Running VisualTrader's Analysis
-
VisualTrader Strategies
-
Performing Real Time Analysis
-
Performing End Of Day Analysis
Running VisualTrader's Analysis
VisualTrader’s first and most important goal is to automate the market analysis and trading process as much as possible. You can set which strategies and test settings VisualTrader will use in your charts from the Strategies and Test Settings tabs on the Edit Strategy Settings dialog box. To open the this dialog box, select Edit » Strategies.
VisualTrader Edit Strategy Settings Dialog Box
The Opportunity List is the window of information that shows the results of VisualTrader’s analysis for each symbol in your profile. Each time you make a change to the settings in the Edit Strategy Settings dialog box or when you update data, VisualTrader will perform the necessary analysis for your changes and display the results in the Opportunity List.
VisualTrader also displays the following indicators in the status bar at the bottom of your screen to give you statistics on VisualTrader’s analysis.
• A — Specifies the percentage of all analysis VisualTrader has completed on the collected data.
• S — Specifies the average time in milliseconds that it has taken VisualTrader to generate signals for each symbol.
• P — Specifies the average time in milliseconds that it has taken VisualTrader to complete pattern analysis on each symbol.
• Q — Specifies the number of symbols VisualTrader has yet to analyze.
VisualTrader Analysis Status Bar
VisualTrader Strategies
Strategies are activated individually using the [...] button to the right of the Strategy name in the menu above your Opportunity List. All Strategies is the default selection. The following VisualTrader Strategies come standard with VisualTrader:
• VT Gap — This Strategy identifies gaps confirmed by strong volatility breakouts. It identifies strong gaps in the market.
Breakout Strategy Applied to Applied Materials
Signal Generator (Trading System) — GAP-B (Gap Breakout), non-optimized
Dynamic Filter — Volatility Breakout Indicator, non-optimized
• VT Breakout — This Strategy looks for volatility breakout signals in the direction of the prevailing trend by confirming against an Exponential Moving Average. It identifies strong breakouts in the prevailing direction of trend.
VisualTrader Analysis Status Bar
Signal Generator (Trading System) — VTY-B (Volatility Breakout), non-optimized
Dynamic Filter — Exponential Moving Average, non-optimized
• VT Trending — This Strategy looks for trending moves identified by Random Walk confirmed by BULL-Power and BEAR-Power indicators. This is a good general purpose strategy in that it will tend to fire signals on strong new moves in the direction of the prevailing trend. It identifies and confirms key reversals within the prevailing trend.
Trending Strategy Applied to Ben-Franklin
Signal Generator (Trading System)—RWI-B (Random Walk Breakout), non-optimized
Dynamic Filter—BULL Power and BEAR Power above zero.
Performing Real Time Analysis
In Real Time Profiles, the data collection, portfolio updates, and testing run continuously. When VisualTrader loads a Real Time Profile, the Real Time Process runs one time through all the symbols in the Opportunity List. As it reaches each one, it contacts the data provider and requests historical bars based on the Data Periods dialog box settings. As data arrives, VisualTrader analyzes it and generates signals in Real Time.
Normally, a Real Time Profile initiates the Real Time process by itself as long as you are already connected to the Internet. When you load a Real Time Profile, it automatically begins the process of analysis and signal generation. When Real Time is running, the miniature-moving chart appears in the lower left corner of the display.
Real Time Process in the Status Bar
To stop the Real Time Process for any reason, click on the moving chart, which will change to a solid red bar (indicating the Real Time process is temporarily disabled). Click the bar again to restart the process.
Performing End Of Day Analysis
In End-of-Day Profiles, the data collection, portfolio updates, and testing run each time VisualTrader recognizes a change which would require updates to the analysis results. If you are using OmniData and you want the analysis to occur at more regular intervals, you can select Edit»Data Settings and modify the data settings.
Data Settings Dialog Box
Select Automatically download EOD data to set VisualTrader to automatically update data each time it is available from your data vendor. Select Update EOD quotes every x minutes to specify that VisualTrader gather data at the specified time interval.
-
Charts
Charts
VT includes a wide selection of chart tools. Learn how to use them in this tutorial.
-
Charting Symbols
-
Charting Groups
-
Charting all Symbols in a Group
-
Plotting Charts on Multiple Monitors
-
Chart Options Chart Tab
-
Changing Chart Colors
-
Plotting Indicators
-
Plotting Trading Systems
-
Displaying Statistics
-
Adding Line Studies
-
Editing the Properties of a Selected Drawing Tool
-
Creating a Chart Layout
Charting Symbols
Symbols are represented as cylinders in VisualTrader. Clicking on a cylinder will immediately bring up a chart for the security it represents. You can also chart a symbol by clicking on it in the Opportunity List.
You can remove a chart from your screen either by clicking on the “X” at the top, right-hand corner of the chart window, or simply by pressing the on your keyboard.
Charting Symbols Example
The chart for FWRD was brought up by placing the mouse over this stock's Cylinder and clicking once.Another quick way to chart a symbol is to type it into the Quick Chart field and press on your keyboard. A chart is immediately displayed, and the symbol is highlighted in the list. If you do not already have that symbol in your current Map, a cylinder will be added to the Miscellaneous Group plate.
Charting Groups
The plates in VisualTrader usually represent industry groups, with the components of that group (security cylinders) resting on the plate. Clicking on the plate will bring up a chart for that industry group. This chart is a composite representation of all of the stocks on that plate.
Composite Representation of All Stocks on the Plate
You can also view the composite group chart of a symbol by clicking the Group button in the Chart Toolbar. For example, let’s say that you have a chart for Walmart (WMT) displayed. By clicking on Group button, you will immediately see the composite chart of the Retail Broad Base industry group displayed.
Charting All Symbols In A Group
VisualTrader gives you the ability to view a chart for all the stocks in an Industry Group simply by holding down the key and then clicking on the plate of the Industry Group. You can also chart all of the symbols in a group by holding down your key and then clicking on the group in your Opportunity List.
Chart of All Symbols in the Gold Group
Plotting Charts On Multiple Monitors
You may view more charts in VisualTrader when you are using multiple monitors.
To plot charts on multiple monitors follow these instructions:
1. Right-click any symbol in the Opportunity List.
2. Select Plot » Floating Chart. A floating chart will appear in the VisualTrader window.
3. Click in the title bar of the chart and hold the mouse button down while dragging the chart to the desired monitor.
4. Close the charts using the X at the top right corner of the chart. The Window » Close All Charts function will not close floating charts.
Chart Options Chart Tab
Chart Options Dialog Box
The Chart tab contains the following options:
• Chart Style — Select from Auto, Bar, Candle, or Line.
• Font — Sets the font, font style, and font size for your charts.
• Price Scale Left — Displays the price scale on the left of the chart. The default is to have the price scale on the right of the chart.
• Display Grid — Plots a price grid on your charts.
• Mark the Backtest Period — Shows the data range that is used for back testing, as defined on the Test Settings tab of the Edit Strategy Settings. The back test period is represented by a dashed line around the back test data set.
Open Map Dialog Box
Changing Chart Colors
On the Colors tab you can change the color of various chart features. To create multiple custom Color Schemes, save your changes as a new template.
Chart Options Dialog Box
Plotting Indicators
VisualTrader contains over 80 of the most popular Technical Analysis indicators.
Chart Options Dialog Box
To add an indicator to your charts, click the checkbox in the Enable column next to the indicator name or right-click in the chart and select Add Indicator. You can disable the indicator in the Chart Options dialog box, or you can right-click on it and select Delete. You can also click on an indicator to highlight it and then press the key on your keyboard. For more information on the indicators in VisualTrader, please refer to the Indicators and Systems Help File. You can access this file by selecting Help » Indicators and Systems in VisualTrader.
Plotting Trading Systems
You can plot Trading Systems on your charts by enabling them on the Systems tab. The system will remain plotted until you deselect it or click the All Off button.
Chart Options Systems Tab
The systems are plotted with the default parameters. Once you have added it to your charts, you can change the parameters and line styles of a system by double-clicking on it's name or by clicking on the Edit button in the Chart Options dialog box. If you want to change the default parameter values, you can either type in the desired system values or use the scroll bar to adjust the parameters.
For more information on the systems in VisualTrader, please refer to the Indicators and Systems Help File. You can access this file by selecting Help » Indicators and Systems in VisualTrader.
Displaying Statistics
VisualTrader allows you to display various chart statistics, such as Symbol, Exchange, Open Price, Close Price, Volume, etc., at the top of the chart.
Statistics Displayed in Chart Toolbar
To access the statistics, complete the following steps:
1. Select Edit » Chart Options.
2. Select the Statistics tab.
Chart Options Statistics Tab for the Trending Template
Click in the drop-down menu next to each Statistics Field to select the statistics you want to display on your charts. Remember that this setting, like all Chart Options settings, is template specific.
Adding Line Studies
The chart tools menu gives you the ability to draw line studies on your VisualTrader charts. You can draw Trendlines, Support and Resistance Lines, the Rule of Eighth’s Lines, and Fibonacci Retracements.
By right-clicking on a chart in VisualTrader, you are presented with a menu of Charting Tools.
Charting Tools Right-click Menu
• Draw Support/Resistance Line — Draws a horizontal support/resistance line that will continue to the right edge of the chart.
• Draw Trendline Segment — Draws a trendline with no extension
• Draw Trendline Ray — Draws a trendline that extends in one direction.
• Draw Trendline (Full line) — Draws a trendline that extends in two directions.
• Trendline with Alerts — Draws a trendline and lets you configure an alert for the trendline.
• Draw Rule of Eighth's — Draws either the Rule of Eighth's lines on the chart. The Rule of Eighth's option divides a drawn line into eight equal segments, using the Rule of Eighth's trade management tool. For more information, refer to the Profiting with Chart Patterns seminar by Ed Downs.
• Draw Fibonacci Retracement — The draw Fibonacci Retracement option plots the 38%, 50%, and 62% retracement levels from user-defined peak and valley levels.
• Add Text — Allows you to annotate the chart.
• Add Signal — Plots a signal and user-defined exits. Exits can be selected and edited by double-clicking on a plotted signal.
• Properties — Allows user to edit line styles of selected line.You can also select a drawing tool or delete all of the drawings on your chart by right-clicking on the chart and using the menu that appears.
Editing The Properties Of A Selected Drawing Tool
There are two methods for accessing the line properties of each drawing tool:
• Right-click on the drawing tool once it's drawn on the chart and select Properties.
• Double-click the drawing on the chart to load the properties window.The Drawing Tool Properties dialog box will appear on the chart.There are two methods for accessing the line properties of each drawing tool:
• Right-click on the drawing tool once it's drawn on the chart and select Properties.
• Double-click the drawing on the chart to load the properties window.The Drawing Tool Properties dialog box will appear on the chart.
Drawing Tool Properties Dialog Box
• Color — Changes the color of the line study on the chart.
• Width — Controls the width of the line in the chart.
• Alert Line — Allows user to set the line as an active alert.
• Show Line Across All Timeframes — Enabling this option will allow the line study to be plotted across all timeframes that are available in the profile.
• OK — Saves the changes made to any of the properties.
• Cancel — Cancels any changes that were made to the property settings.
• Apply — Click this option to save and apply any changes made to the properties.
• Set as Default — Saves the edited properties to be applied each time the edited study is drawn on a chart.
Creating A Chart Layout
To create a Layout page, right-click on the Charts Form in the bottom right of your VisualTrader screen and select Add Layout. You will see the New Layout dialog box where you can name the new layout.
New Layout Dialog Box
The display on the screen now has four boxes. These boxes are referred to as Panes, and they serve as placeholders for charts. You can have as many or as few Panes in your Layout as you want. To create additional Panes, click on the outer edge of an existing Pane and, holding your mouse button down, drag away from the edge. You will see a new Pane appear almost immediately. You can also reduce the number of Panes by dragging the inner border of a Pane towards an outer edge.
The Initial Layout Screen with Four Panes
-
Chart Patterns
Chart Patterns
Learn how to use VT's advanced Chart Pattern Recognition to identify prime pattern setups.
-
Viewing Patterns in the Chart
-
Editing Pattern Settings
Viewing Patterns In The Chart
To activate the Patterns feature, select View » Patterns Feature or use the Docking Toolbar at the bottom of the window in VisualTrader. The Patterns button allows you to add chart pattern confirmation to your trading. Chart patterns help you determine whether or not a confirming pattern occurs with a given signal in the Opportunity List.
Use the buttons 1 - 5 to set the strength of the patterns you would like displayed on the chart. Selecting 1 will allow all the patterns found to be displayed in the chart. Setting the strength to 5 will only allow the best patterns found to be displayed. The Off button will remove all patterns from the chart.
Patterns Feature
You can also access the Patterns feature by selecting Edit » Patterns in VisualTrader.
Editing Pattern Settings
Click the Patterns button to launch the Edit Pattern Settings dialog box. From the Edit Pattern Settings dialog box, you can add the following assistants: Trend Lines, Support and Resistance Lines, Fibonacci Retracements, Candles, Assistant Tags, Pivot Points, Fibonacci Indicators, and Forming Patterns.
1. Click the Patterns button.
Edit Pattern Settings Dialog Box
2. Make your pattern selections in the dialog box.
3. Click Close to submit your selections and display them immediately in the chart.
The Edit Pattern Settings dialog box contains the following options:
• Short, Medium, and/or Long — Specifies the term for each pattern. A short-term pattern occurs from 1-16 bars. A medium-term pattern falls between 17-32 bars, and a long-term pattern occurs at 33 bars or greater. For Support & Resistance and Trendlines, the term is determined by the pivot points that the pattern uses.
• None or All — Specifies whether VisualTrader will display Candle patterns.
• Focus List & Charts Display Tolerance — Specifies the number of bars tolerance to use when displaying forming patterns.
• Display Forming Patterns — Displays patterns that are beginning to form at the right edge of the chart.
• Assistant Display Settings — Specifies whether VisualTrader will display Assistant Tags. The Assistant Text Color option determines the color of the tag text. When you mouse over a tag in a chart, the Pattern Recognition Module displays the name of the pattern in the color you specify.
• Pivot Points — Specifies whether to find pivot points that reinforce the short, medium, or long-terms used in VisualTrader.
• Fibonacci Indicators — Specifies whether to display Short, Medium, or Long-term retracements on the right side of the chart. Fibonacci Retracements indicate reversal points on a price chart using ratios computed from Fibonacci numbers.
-
Alerts
Alerts
Learn how VT brings the trades to you using Signal, Pattern, and Indicator Alerts.
-
Signal Alerts
-
Signal Alert Options
-
Chart Tool Alerts
-
Fired Alerts
-
Resetting an Alert
-
Using the Position Summary Window
Signal Alerts
You can add alerts for symbols based on current signals or patterns from the chart using the Add Alert feature in VisualTrader.
Add Alert Dialog Box
To add a signal or pattern alert to a symbol in the Opportunity List, complete the following steps:
1. Click a symbol in the Opportunity List to open the chart.
2. Right-click in the chart and select Add Alert from the right-click menu. VisualTrader will display the Edit Alert dialog box.
3. Select the appropriate statistic from the Item drop-down menu.
4. Specify any changes you would like in the window. See next topic for option descriptions.
5. Click Save to enable the alert. The symbol will be added to the Active Alert List.
Signal Alert Options
The following Signal Alert options are available in VisualTrader.
Add Alert Dialog box
Signal Items:
• New Signal— Alert for one symbol that fires when a new signal is formed on the current bar. After firing, this alert is no longer active unless the Always Active option is enabled.
• Any New Signal—Fires alert when a new signal is formed on the current bar for every symbol in your Opportunity List. This alert remains active until cancelled by the user.
• New Pattern— Alert for one symbol that fires when a new pattern is formed on the current bar. After firing, this alert is no longer active.
• Any New Pattern—Fires alert when a new pattern is formed on the current bar for every symbol in your Opportunity List. This alert remains active until cancelled by the user.
Signal Alert Type specifies the type of signal to fire an alert on. The signal type options are:
• Pending
• Entry
• Reinforced
• Pending Exit
• ExitSignal Alert Direction allows you to specify signal direction.
•Long
• Short
• BothAlways Active is only available with the New Signal Alert. If enabled the New Signal Alert will remain active for the symbol after it has been fired.
Play Sound enables an audible alert. Specify your own .wav file to play by clicking the ellipsis button.
Show Message Box with Symbol displays a message window when the alert fires.
Select Day or GTC. Good Till Cancelled (GTC) means that the alert will remain active until you cancel it yourself. Day means that the alert will expire at the end of the day.
Set Defaults allows you to save the specified options for the next alert.
Chart Tool Alerts
The chart tools can be accessed from the right-click menu in any chart. From there you may choose to draw Trendlines, Support and Resistance Lines, and the Rule of Eights tool with an alert attached to it. When one of these alert tools is selected from the right-click menu and placed on the chart, the symbol will automatically appear in the Active Alert List. The Alerts box will display the symbol with a red or green background according to where it is drawn on the chart.
Fired Alerts
Once price has penetrated an alert line or a signal alert has fired, the symbol will be shown in the Fired Alert List, where it will flash to let you know that an alert has been fired. VisualTrader will also give you an audible notification of the alert firing.
In the example below, NXTL moved through the Support Line, triggering an alert. Notice how the symbol moved from the Active Alert List to the Fired Alert List.
NXTL Moves to the Fired Alert List Once the Support Line is Penetrated
To review a chart on the Fired Alert List, Active Alert List, or Watch List, just click on the corresponding symbol in the list.
Note: The chart tools menu allows you to draw Trendlines, Support and Resistance Lines the Rule of Eighth’s line, and Fibonacci Retracements. You can also apply alerts to Trendlines, Support & Resistance Lines, and the Rule of Eighth's line. After you apply a line study to your chart, right-click on the chart and select Set as Alert Line to have VisualTrader automatically alert you once price has penetrated that line.
Resetting An Alert
You have the ability to reset an alert in VisualTrader once it has been fired. Click on the line, which is associated with the alert, and move it slightly. Once you release your mouse button, the alert will be reset. Signal alerts do not have this functionality.
To illustrate this process, we have reset the alert for NXTL from the previous example. Notice how the symbol has moved back to the Active Alerts List from the Fired Alerts List.
Adjusting the Alert Line Resets the Alert for NXTL
Using The Position Summary Window
The buttons at the top of the Position Summary Window allow for different views and quick close buttons in case you want to get out of all your positions quickly.
• Open — View your open positions.
• Closed — View your closed positions.
• All — View all your open and closed positions.
• CL — Close all your open long positions.
• CS — Close all your open short positions.
• CA — Close all your open positions.
-
Trading Tools
Trading Tools
Learn how to place trades in the charts and how to use VT's advanced trading tools.
-
Entering a Position
-
Closing a Position
-
How Trade Plans Work
-
Activating Trade Plans
-
Trade Plan Template
-
Position Summary Window
-
Using the Position Summary Window
Entering A Position
You can place an order to buy or sell a security by dragging and dropping the Chevron on the right edge of the VisualTrader Chart. When you use the trading chevron to enter a position, the position is entered for the currently displayed security or the security that has focus, if there are multiple symbols plotted.
With the chart of the security displayed, drag the trading chevron into place on the chart.
Once you release the chevron, OmniTrader plots the stops that are defined for Step 1 of the Trade Plan, and the Trade Plan interface is displayed.
Trade Plan Setup for a Long Position
Closing A Position
Once you have submitted a position, you may want to close the position. You can close a position in many ways, but one of the easiest is to use the Trading Chevron in the chart.
1. In the Focus List, double-click on the symbol for the security that has the position you want to close. This will display the chart for the selected security.
2. Right-click the Chevron and select Close Position. VisualTrader will immediately record the position as closed
You can also close a single position or all the positions in an account from the Open Positions tab in the Portfolio window.
1. Click on the Accounts button on the Brokerage Toolbar.
2. From the drop-down menu, select the account that contains the position you would like to close.
3. Click on the Open Positions tab.
4. Click to highlight the position that you want to close, and click the Close Position button. You will see the Close Position dialog box.
5. Confirm that the details are correct and click OK to immediately close the selected position.
Note: You can also close all the positions in the selected account by right-clicking and selecting Close All Positions and then confirming the closure. In this case, the position is not immediately closed but is submitted for closure.
How Trade Plans Work
Trade Plans use a step-by-step process to manage a trade. Each step contains conditions that define what to do if that condition is met. The following flow chart illustrates this process for a hypothetical Trade Plan:
Flow Chart of the Trade Plan Process
When the Trade Plan moves to a new step, the conditions from the previous step are no longer active. A Trade Plan can have a single step (sell/cover 100% of the initial order) or multiple steps.VisualTrader looks for the initial order to be resolved in the Trade Plan. It also checks all of the conditions and orders to make sure that they are valid. If it finds a conflict, the conflicting area is highlighted in orange. You will need to resolve the problem before you will be able to save the Trade Plan.
Activating Trade Plans
You can activate a Trade Plan by dragging and dropping the Trading Chevron found in the top right corner of your chart.
Trade Plan Order Entry Chevron
Once you release the chevron, VisualTrader plots the stops that are defined for Step 1 of the Trade Plan, and the Trade Plan Setup dialog box is displayed.
Trade Plan Setup Dialog Box with Initial Stops Displayed
Trade Plan Template
Trade Plan Templates are designed to emulate a particular type of trade management. Each Trade Plan template has its own configuration for managing the trade. When you select a template, VisualTrader loads the template settings. Once a Trade Plan template is applied to a security, the Trade Plan is no longer associated with the original template. This means that any changes you make in the Trade Plan will not be made in the template and vice versa. The following Trade Plan templates are provided:
• Default — Uses a simple Fixed Loss Stop (2 ATR’s) and a Trailing Profit Stop (1.5 ATR’s) to manage a trade.
• Eighth’s Stop — Uses a Fixed Loss Stop (3 ATR’s) as a protective stop and an Eighth’s Tool Stop (1.5 ATR’s) as a profit stop.
• Eighth’s Stop-Partial Exit — Uses a Fixed Loss Stop (3 ATR’s) as a protective stop and exits half the trade once price hits a Fixed Profit Stop (1.5 ATR’s). This Trade Plan manages the remaining half of the trade with a 1.5 ATR Eighth’s Stop.
• Long Term Trending — Uses a Fixed Loss Stop (3 ATR’s) as a protective stop and a Trailing Profit Stop (Threshold = 4 ATR’s, Cushion = 3 ATR’s) as a profit stop. It will also activate a Break Even Stop (1.5 ATR’s) once price exceeds 2 ATR’s to the gain side.
• Medium Term Trending — Uses a Fixed Loss Stop of 3 ATR’s as a protective stop and a Trailing Profit Stop (Threshold = 3 ATR’s, Cushion = 2 ATR’s) as a profit stop.
• Partial Exit — Uses a Fixed Loss Stop (2 ATR’s) as a protective stop, and it will exit 50% of the initial position if price hits a Fixed Profit Stop of 2 ATR’s. The remainder of the trade is managed with a Trailing Profit Stop (Threshold = 2 ATR’s, Cushion = 2 ATR’s).
• Short Term Trending — Uses a Fixed Loss Stop (2 ATR’s) as a protective stop, and a Trailing Profit Stop (Threshold = 2 ATR’s, Cushion = 1.5 ATR’s) as a profit stop.
Position Summary Window
The Position Summary window shows position information for the active account at a glance.
Position Summary Window
• Symbol — Symbol that is in trade.
• D — Type of position (long/short)
• Shares — Number of shares traded for a symbol
• Gain% — Percentage gained or lost for the active trade.
• Prices — Tick marks in the list represent a percentage unit in price movement - not position gains/losses. if the exact same number of shares is traded, they will line up.
• Gain$ — Gain or loss dollars for an active trade.
Using The Position Summary Window
The buttons at the top of the Position Summary Window allow for different views and quick close buttons in case you want to get out of all your positions quickly.
• Open — View your open positions.
• Closed — View your closed positions.
• All — View all your open and closed positions.
• CL — Close all your open long positions.
• CS — Close all your open short positions.
• CA — Close all your open positions.
-
Simulation
Simulation
Learn the software in accelerated play before you take on the real market.
-
Running a Simulation
-
Trading in Simulation Mode
-
Simulation Mode Options
-
Activating the Playback Feature
-
Running the Playback Feature
-
Viewing Momentum Shifts
Running A Simulation
A Trading Simulation session can be run using any existing VisualTrader Map that has data collected. You should open the VisualTrader Map you would like to use for the Simulation and make sure the correct settings are enabled prior to running it. Simulation Mode is accessed from the Playback tool in VisualTrader.
Follow the instructions below to run a Simulation.
1. Open the VisualTrader Map you would like to use for the Simulation.
2. Set the Timeframe, Strategies and Patterns you will be using.
3. Click View » Playback Feature to bring the tool onto the Map.
4. Click the Simulator button found on the Playback tool.
Playback Tool
5. The Start Simulator Dialogue box will appear asking if you would like to Start a new Simulation Session or Continue an Existing Simulation Session. Make your selection and click OK.
Start Simulator Dialogue Box
6. The Simulator is loaded and is indicated by the data feed connection status turning red in the VisualTrader Map indicating that it is disconnected from the feed. The Simulator button will blink and the Brokerage Toolbar will change to read Simulation Mode.
The time frame that was selected when entering Simulation Mode will become the Primary Data Period and will remain highlighted until Simulation Mode has been exited. You may switch to other time frames while in a Simulation, but the advancing of data is disabled while viewing data periods other than the Primary Data Period. In order to access the Next, Pause, and Play buttons you will need to return to the Primary Data Period.
VisualTrader Map with Simulation Mode Active
7. Set the speed to Fast, Medium or High and position the Playback Start Flag on the slider bar.
8. Press Play to begin the Simulation and the start date will appear to the left of the Simulator button.
The Pause button will temporarily stop the simulation and the Next button can be used to advance the Map by one bar while paused. Pressing Play will resume the Simulation. Stop will end the Simulation and return the Map to the current date/time.
9. End the Simulation by clicking the Simulator button again. A prompt will appear asking you to confirm exiting the Simulator.
Simulation Exit Dialogue Box
Trading In Simulation Mode
Trading with the Simulator is fun and easy. There is no limit to the number of positions that can be taken in Simulation Mode and VisualTrader will manage them automatically using Trade Plans.
1. View the Map and Opportunity List to find good candidates.
2. Click a symbol in the Map or List to bring load a chart and drag the Chevron onto the chart to open a simulated position.
3. The Trade Plan window will appear allowing you to select the Trade Plan you want VisualTrader to use to manage the trade.
4. Enter the Quantity and click the Submit button.
5. The open position will appear in the Position Summary window at the bottom of VisualTrader.
6. Positions can be monitored in the Simulation Mode portfolio account. Click the Accounts button on your Brokerage Toolbar to access the portfolio.
Simulation Mode Options
Simulation Mode options are found by clicking Tools » Options » Playback.
Simulation Mode Option Dialog Box
Enabling this option will allow completed bars (future data) to be visible in other time frames. This option handles how the current bar is displayed when switching to other data periods that isn't the Primary Data Period. With the option unchecked (the default selection), higher time frame bars will not be displayed in charts until the Primary Data Period has caught up to completed bar of the higher time frame. With the option enabled you are able to view higher time frame completed bars which can lead to cheating.
For example, with the option enabled, your primary data period is set to 5 minutes, viewing the 1:30PM bar and you then switch to the 15 minute time frame, the 1:30 bar now shows the completed 15 minute bar. If the option is disabled, viewing the 15 minute data period will show the last completed bar (1:15pm).
Activating The Playback Feature
To activate the Playback Feature, click on View » Playback Feature. The Playback Feature will appear at the bottom of your VisualTrader screen.
When using the Playback Feature, you can have the current playback date indicated on charts in one of two ways. You can have a red vertical line illustrating the date, or you can have the chart adjust so that the playback date is the last bar on the chart. To specify which option you would like, right-click on Playback Feature Control and select your desired preference.
Running The Playback Feature
There are a few different ways to run the playback. You can grab the green slider and scroll back and forward to different moments in time to see how the Map looked at that particular instant. You can also use the arrows on each side of the scroll bar to move back and forward one bar at a time.
The most commonly used method of playback is to use the Playback Start Flag. Position this flag where you would like the playback to begin, and then each time that you click the Play button, the playback will automatically start at that point and run to the current bar.
Playback Start Flag
Viewing Momentum Shifts
When you engage the Playback Feature, you can see the momentum shifts from one industry group to another. The Playback Feature not only shows you the state of the market at particular time, but it also displays the shift in the strength and weaknesses of industry groups. By letting the Playback Feature “play” over the latest bars of data, you will see certain groups gain momentum, helping you to confirm the direction of the group as well as the market as a whole.
Another use of the playback tool is to see the type of candidates that each Transform will present for you. We recommend that you use the Playback Feature to actually see how each Transform reacts to market data. This will help you in deciding which Transform best suits your trading style.
Playback Feature