


Now’s the Time to Apply the
HURST Cycle Trader to This Market!

I know that traders are keenly interested in pin-pointing the cycle highs in today’s Market. The best approach I’ve found to accurately identify cycles uses the stellar work of Market Technician J.M. Hurst. Reading his book "The Profit Magic of Stock Transaction Timing" many years ago was the catalyst that got me started thinking about how to write automated trading systems that could find ideal entry points in the stock market.
Hurst’s book was way ahead of its time and has gained a strong following among traders and investors.
Hurst demonstrates that there are certain cycles that occur over and over again in the stock market and shows how to identify these cycles and time an ideal entry point for a low-risk trade. Then, he shows how to manage the trade to maximize profits.
I want all of our customers to succeed in this Market and I can’t think of a better plug-in for you to incorporate Right Now. Best of luck to your trading in the upcoming months!
Now’s the Time to Apply the HURST Cycle Trader to This Market!
I know that traders are keenly interested in pin-pointing the cycle highs in today’s Market. The best approach I’ve found to accurately identify cycles uses the stellar work of Market Technician J.M. Hurst. Reading his book "The Profit Magic of Stock Transaction Timing" many years ago was the catalyst that got me started thinking about how to write automated trading systems that could find ideal entry points in the stock market.
Hurst’s book was way ahead of its time and has gained a strong following among traders and investors.
Hurst demonstrates that there are certain cycles that occur over and over again in the stock market and shows how to identify these cycles and time an ideal entry point for a low-risk trade. Then, he shows how to manage the trade to maximize profits.
I want all of our customers to succeed in this Market and I can’t think of a better plug-in for you to incorporate Right Now. Best of luck to your trading in the upcoming months!
The Profit Magic of Nirvana’s
The Hurst method is one of the most powerful approaches to trading ever disclosed to the public. As I mentioned in the introduction, it was J.M. Hurst who fired my imagination and motivated me to automate the trading process, ultimately leading to the invention of OmniTrader.
As powerful as it is, you would think that someone would have created a Hurst trading program by now. There are a few Hurst trading courses and products that claim to be Hurst-like, but as far as I’m concerned, none embodies the true essence of his method.
The fact is programming the Hurst method is NOT EASY. Stock market cycles are not perfect. Hurst talks about this in his definition of variation in the book. It is difficult to achieve a precise mathematical solution that tells you when to buy or sell.
Implementing the Hurst method required careful attention to detail and a clear understanding about how to write advanced signal generation code–something our Nirvana team is well equipped to do.
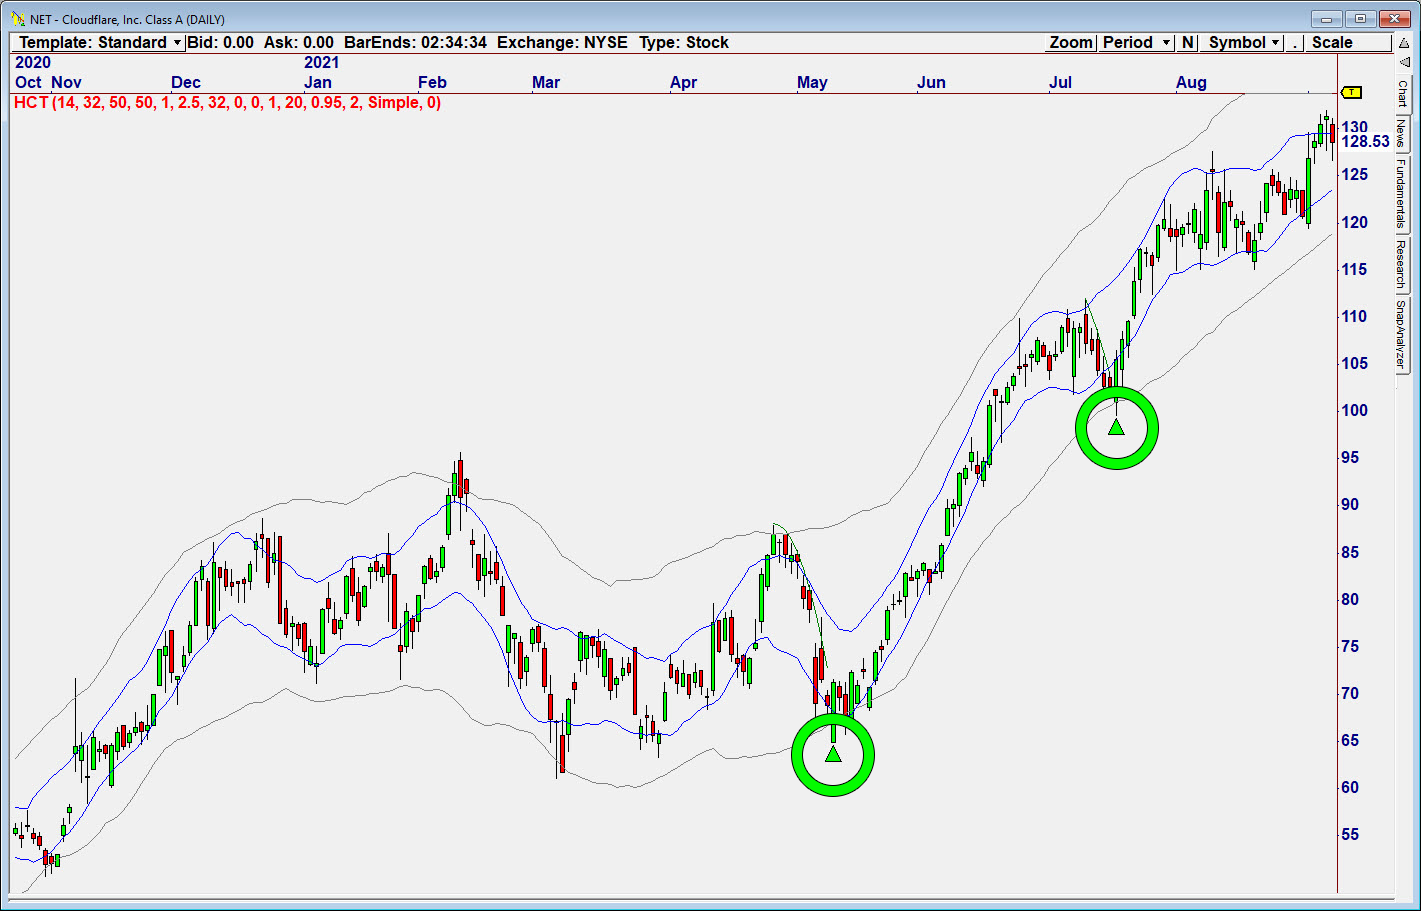
The Hurst method finds explosive reversals by identifying zones where the intermediate
and long term cycles converge. This daily chart of NET shows two powerful Hurst signals.
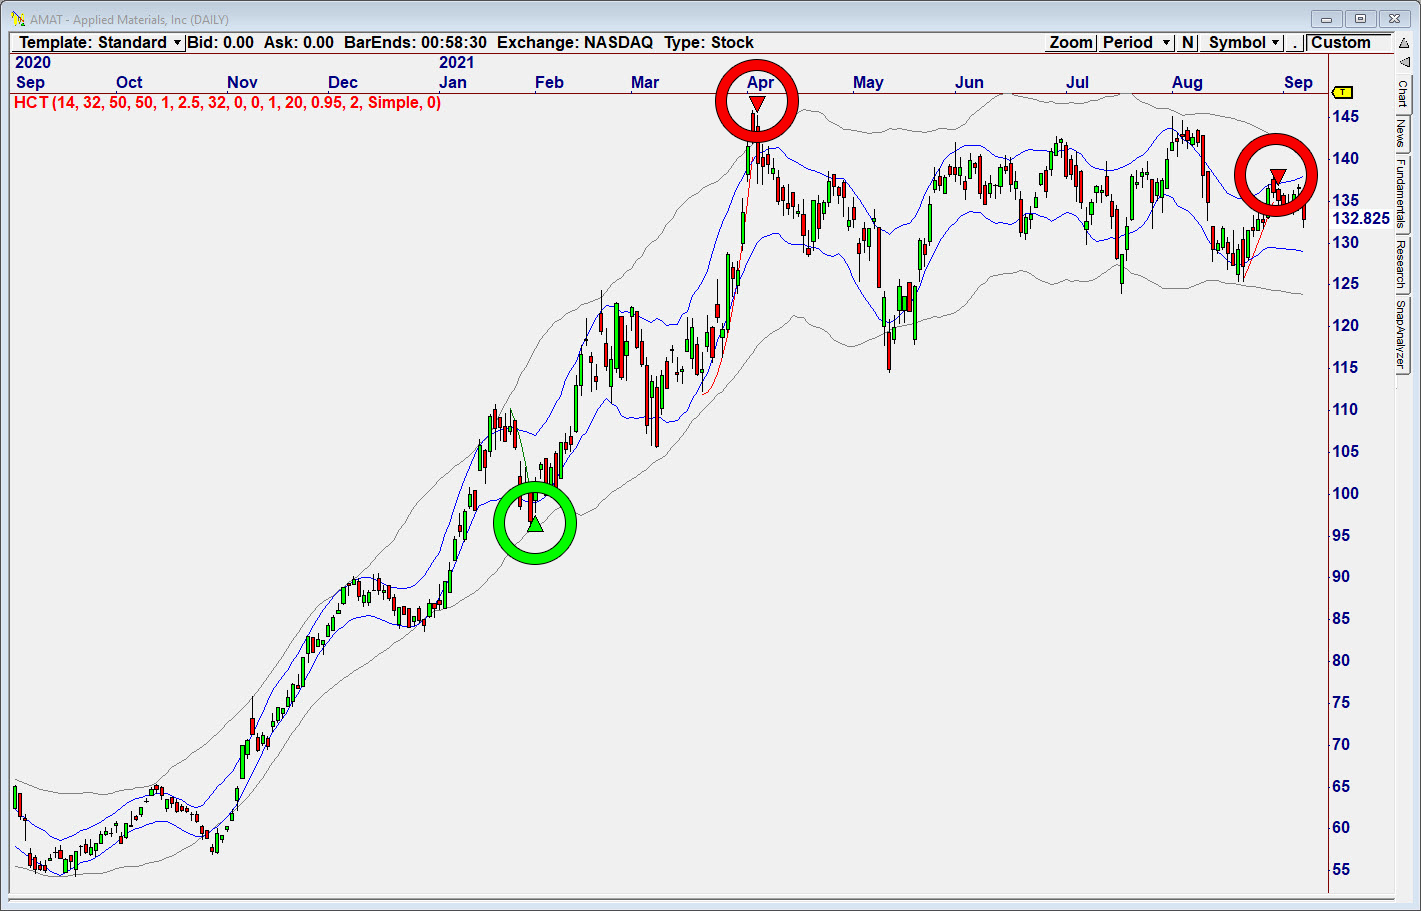
Here are several outstanding Hurst signals on AMAT.
The Profit Magic
of Nirvana’s
The Hurst method is one of the most powerful approaches to trading ever disclosed to the public. As I mentioned in the introduction, it was J.M. Hurst who fired my imagination and motivated me to automate the trading process, ultimately leading to the invention of OmniTrader.
As powerful as it is, you would think that someone would have created a Hurst trading program by now. There are a few Hurst trading courses and products that claim to be Hurst-like, but as far as I’m concerned, none embodies the true essence of his method.
The fact is programming the Hurst method is NOT EASY. Stock market cycles are not perfect. Hurst talks about this in his definition of variation in the book. It is difficult to achieve a precise mathematical solution that tells you when to buy or sell.
Implementing the Hurst method required careful attention to detail and a clear understanding about how to write advanced signal generation code–something our Nirvana team is well equipped to do.
The Hurst method finds explosive reversals by identifying zones where the intermediate
and long term cycles converge. This daily chart of NET shows two powerful Hurst signals.
Here are several outstanding Hurst signals on AMAT.
The HURST Method
Transaction Timing Equals Profitable Trading
What is the Hurst Method?
Before talking about the software, it’s important to understand the method, so I’d like to summarize it here with the help of some figures from Hurst’s book. Figure IV-4 shows how one can draw envelopes around price action to predict the next cycle low, labeled L-3 in the diagram.
After drawing the envelope, we expect to see the shorter term and the medium term cycles turning up at point L-3, provided price follows the envelope pattern. By looking for these projected cycle lows or highs, it is possible to identify “entry zones” where a stock’s price should explosively move in the direction of a new trend, shown as a hatched area in Figure IV-6.
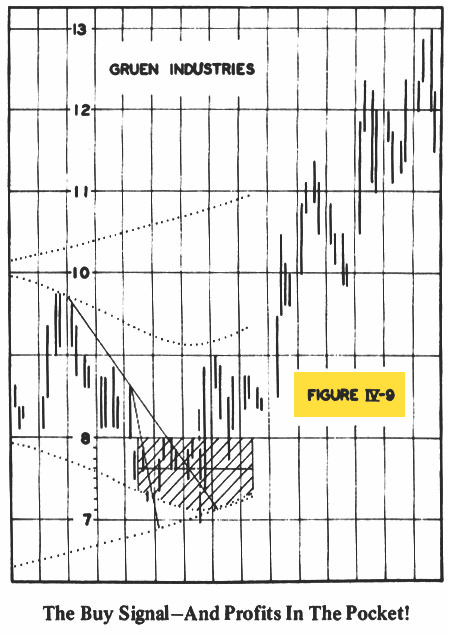
Here’s where the second part of transaction timing comes into play. To arrive at the most precise entry possible, Hurst used Valid Trend Lines—lines drawn across price action at cycle lows (shown in Figure IV-7). When these lines are broken, buy or sell orders are placed in the market (Figure IV-9).
Hurst also taught a way to manage the trades using specialized trailing stops based on levels that take advantage of the natural rhythm of the market. Diagrams in the book graphically show the logic of following a trade and optimizing the exit based on these same cycles.
Automating Hurst
Hurst defined and disclosed a step-by-step approach to identifying the most explosive, high-probability moves in the stock market. While it is certainly possible to draw the envelopes and lines by hand as Hurst suggested, we want OmniTrader to do the job.
We started by defining the cycle envelopes. Hurst talks about using “half-span” or “shifted” moving averages as a mathematical way to do this. For example, if we are using a 64-period moving average we would shift the values left by ½ the span, or 32 periods. You can do this in OmniTrader and you will instantly see nearly-perfect cycles appear in the charts.
From The Profit Magic of
Stock Transaction Timing
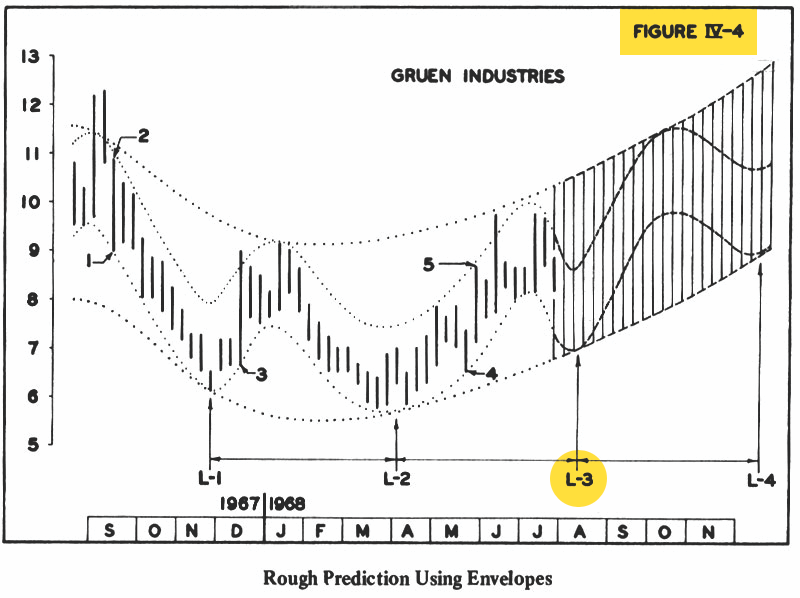
Hurst plotted this stock to show how cycles could
be projected from prior price action (Figure IV-4).
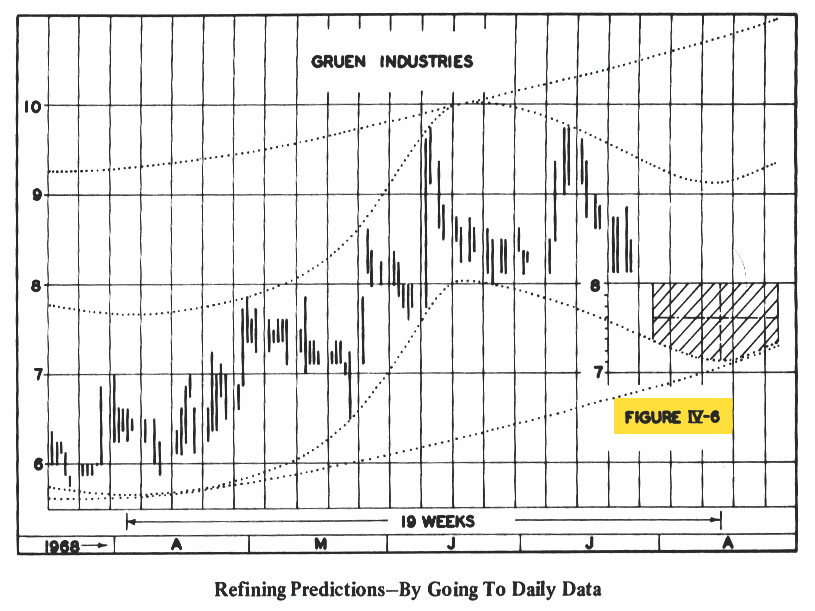
Zooming out on the weekly chart, we draw an action zone at the
probable cycle low and wait for price to get there (Figure IV-6).
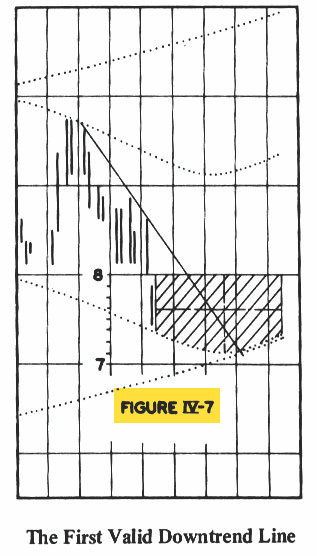
We then draw a Valid Trend Line across downward price action
as it enters the zone (Figure IV-7). When the Valid Trend Line is broken,
we enter our buy order (Figure IV-9). A rigorous Stop Management
System is then applied (not shown here).
However, since the averages are shifted to the left, there is no indicator value on the right edge of the chart. You have to imagine a projection of the bands to the right, as Hurst did in his book using hand-drawn lines.
How did we automate the process? By projecting the envelope into the future through a careful application of regression analysis, we were able to produce a completed envelope at the right edge.
The best place to enter a new long position is when a Major Cycle Low lines up with a Minor Cycle Low. To time the entry, we use a Valid Trend Line across highs. A Valid Trend Line break generates the actual signal. These trend lines have been specially designed to generate the best possible entries.
All of this work led to the creation of what we believe to be the first Hurst System implementation available to traders. Hurst Cycle Trader does not generate a lot of signals, but those it DOES generate tend to be very accurate.
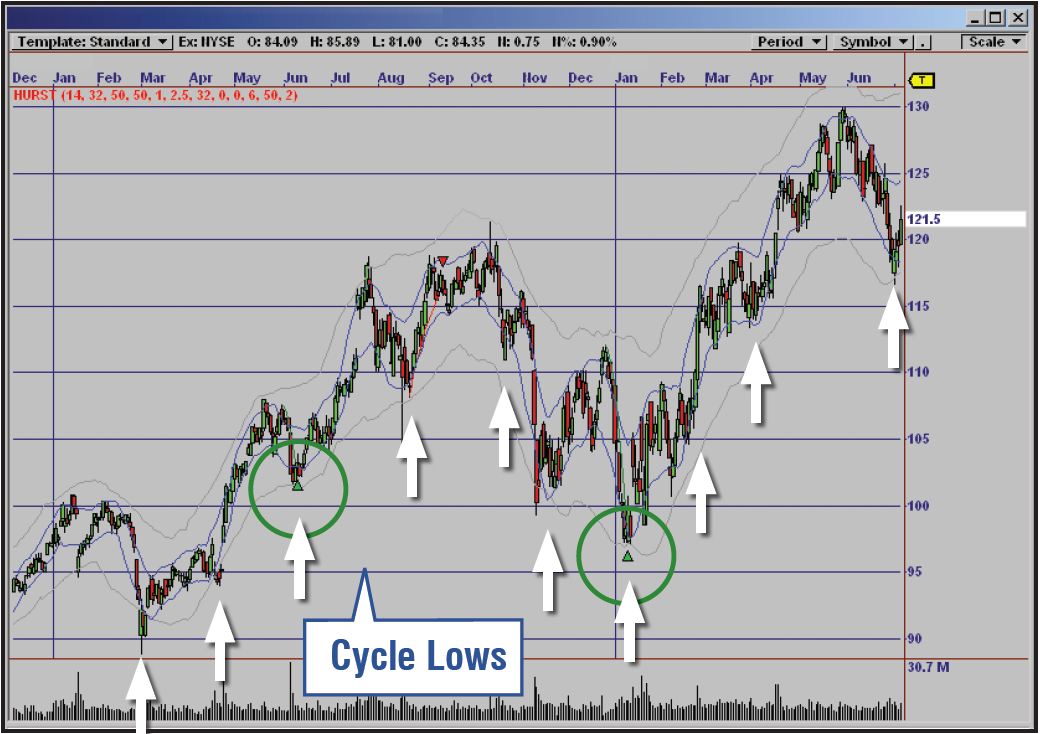
Cycle Lows - Note how the Major and Minor Cycles
lined up to provide a nearly perfect entry signal.
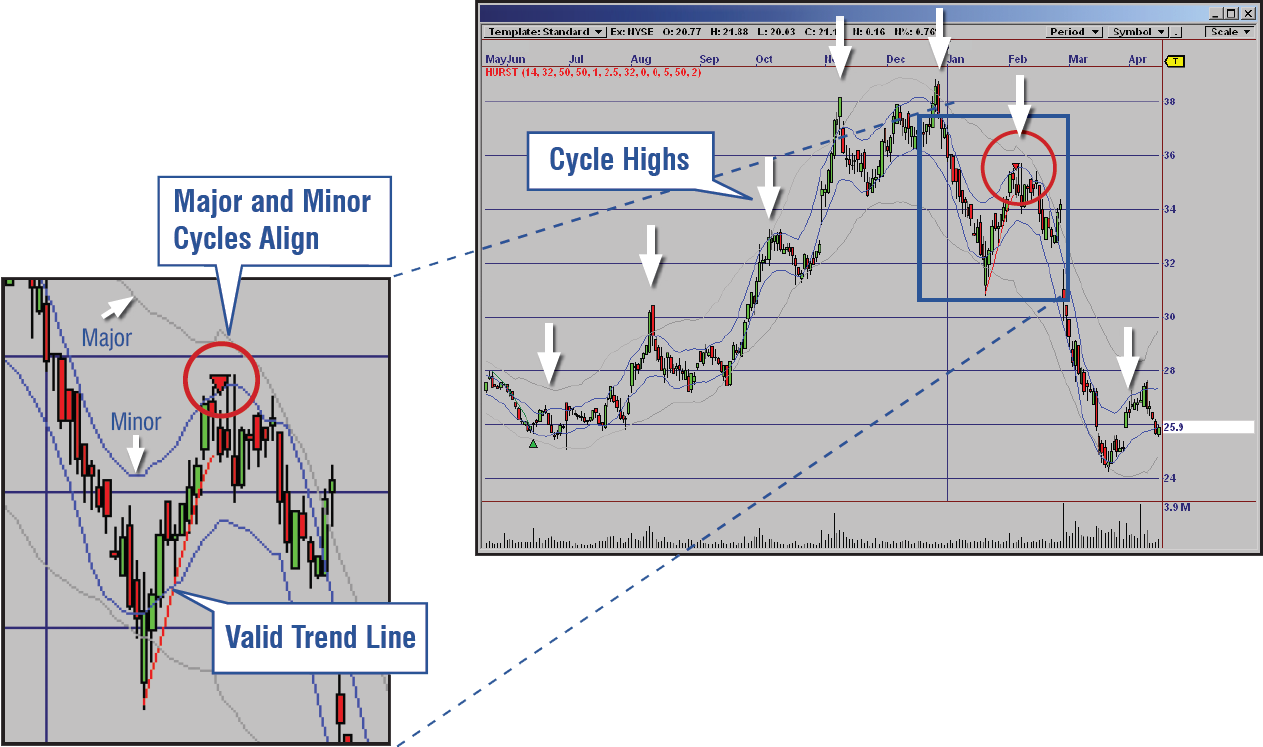
Cycle Highs - Again, the Hurst Cycle System looks for
places where the Major and Minor Cycles line up, confirmed
by a Valid Trend Line break generating a signal.
The HURST Method
Transaction Timing Equals Profitable Trading
What is the Hurst Method?
Before talking about the software, it’s important to understand the method, so I’d like to summarize it here with the help of some figures from Hurst’s book. Figure IV-4 shows how one can draw envelopes around price action to predict the next cycle low, labeled L-3 in the diagram.
Hurst plotted this stock to show
how cycles could be projected from
prior price action (Figure IV-4).
After drawing the envelope, we expect to see the shorter term and the medium term cycles turning up at point L-3, provided price follows the envelope pattern. By looking for these projected cycle lows or highs, it is possible to identify “entry zones” where a stock’s price should explosively move in the direction of a new trend, shown as a hatched area in Figure IV-6.
Zooming out on the weekly chart,
we draw an action zone at the
probable cycle low and wait for price
to get there (Figure IV-6).
Here’s where the second part of transaction timing comes into play. To arrive at the most precise entry possible, Hurst used Valid Trend Lines—lines drawn across price action at cycle lows (shown in Figure IV-7). When these lines are broken, buy or sell orders are placed in the market (Figure IV-9).
We then draw a Valid Trend Line
across downward price action as
it enters the zone (Figure IV-7).
When the Valid Trend Line is broken,
we enter our buy order (Figure IV-9).
A rigorous Stop Management System
is then applied (not shown here).
Hurst also taught a way to manage the trades using specialized trailing stops based on levels that take advantage of the natural rhythm of the market. Diagrams in the book graphically show the logic of following a trade and optimizing the exit based on these same cycles.
Automating Hurst
Hurst defined and disclosed a step-by-step approach to identifying the most explosive, high-probability moves in the stock market. While it is certainly possible to draw the envelopes and lines by hand as Hurst suggested, we want OmniTrader to do the job.
We started by defining the cycle envelopes. Hurst talks about using “half-span” or “shifted” moving averages as a mathematical way to do this. For example, if we are using a 64-period moving average we would shift the values left by ½ the span, or 32 periods. You can do this in OmniTrader and you will instantly see nearly-perfect cycles appear in the charts.
However, since the averages are shifted to the left, there is no indicator value on the right edge of the chart. You have to imagine a projection of the bands to the right, as Hurst did in his book using hand-drawn lines.
How did we automate the process? By projecting the envelope into the future through a careful application of regression analysis, we were able to produce a completed envelope at the right edge.
The best place to enter a new long position is when a Major Cycle Low lines up with a Minor Cycle Low. To time the entry, we use a Valid Trend Line across highs. A Valid Trend Line break generates the actual signal. These trend lines have been specially designed to generate the best possible entries.
All of this work led to the creation of what we believe to be the first Hurst System implementation available to traders. Hurst Cycle Trader does not generate a lot of signals, but those it DOES generate tend to be very accurate.
Cycle Lows - Note how the Major and Minor Cycles lined up to provide a nearly perfect entry signal.
Cycle Highs - Again, the Hurst Cycle System looks for places where the Major and Minor Cycles line up, confirmed by a Valid Trend Line
break generating a signal.
Taking Maximum Advantage of Nirvana’s
Power Tools Included with the Hurst Plug-In
In addition to the Hurst Strategy, you get two powerful tools that can be used to improve other strategies in OmniTrader. For starters, you get the new Shifted Moving Average Envelopes, which can draw shifted bands around price and project them forward to the current bar. You also get the Hurst Cycle Trader System (HCT-R), which combines these tools into Hurst signals that can be used in weekly, daily or real time charts.
A Timely Product
Hurst Cycle Trader identifies profitable candidates by taking advantage of the natural cycles that occur in all freely traded markets—including the current volatile market environment.
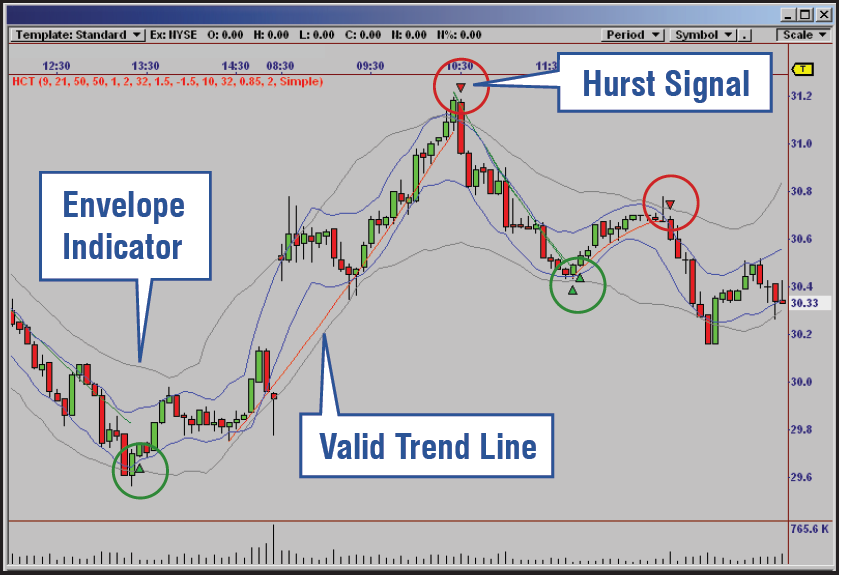
Hurst in Real Time - The above chart demonstrates how powerful and timely these signals can be in real time. In addition to the Hurst Strategy, you also get the components of Hurst, including Shifted Moving Average Envelopes and theHurst System that fires signals when Major and Minor Cycles converge in the chart.
Taking Maximum
Advantage of Nirvana’s
Power Tools Included with the Hurst Plug-In
In addition to the Hurst Strategy, you get two powerful tools that can be used to improve other strategies in OmniTrader. For starters, you get the new Shifted Moving Average Envelopes, which can draw shifted bands around price and project them forward to the current bar. You also get the Hurst Cycle Trader System (HCT-R), which combines these tools into Hurst signals that can be used in weekly, daily or real time charts.
A Timely Product
Hurst Cycle Trader identifies profitable candidates by taking advantage of the natural cycles that occur in all freely traded markets—including the current volatile market environment.
Hurst in Real Time - The above chart demonstrates how powerful and timely these signals can be in real time. In addition to the Hurst Strategy, you also get the components of Hurst, including Shifted Moving Average Envelopes and theHurst System that fires signals when Major and Minor Cycles converge in the chart.
Now’s the Time to Apply the
HURST Cycle Trader to This Market!
$495

Now’s the Time to Apply the HURST Cycle Trader to This Market!
$495
Our software is backed by our unconditional Money Back Guarantee. If for any reason you are not fully satisfied, you may return the software, within 30days of purchase, for a 100% refund, less shipping and handling. Texas residents add 8.25% sales tax. Educational material is non-refundable.
Important Information: Futures, options and securities trading has risk of loss and may not be suitable for all persons. No Strategy can guarantee profits or freedom from loss. Past results are not necessarily indicative of future results. These results are based on simulated or hypothetical performance results that have certain inherent limitations. Unlike an actual performance record, simulated results do not represent actual trading. There are numerous market factors, including liquidity, which cannot be fully accounted for in the preparation of hypothetical performance results all of which can adversely affect actual trading results. No representation is being made that any account will or is likely to achieve profits or losses similar to these being shown.