


Connors RSI
$995
Compatible Platform: OmniTrader / VisualTrader
Recommended Data: End Of Day
The Connors RSI represents a new way to calculate Relative Strength that combines Class (Wilder’s) RSI with two additional indicators. It is this combination that transformed a good indicator into a truly great one!


A New Strategy Based on Connors RSI
Thanks to the new Connors RSI indicator, we were able to apply our additional knowledge to create a phenomenal new Reversion to Mean Strategy!
CRT-3 (Connor’s RSI with Trend) uses CRSI and a new Trend Indicator we developed that isolates those CRSI Signals that are firing in the direction of Trend.
We ALSO applied the Connors RSI method to Stochastics and Williams %R to create two companion Systems that generate additional Signals, improving overall yield from the Strategy.
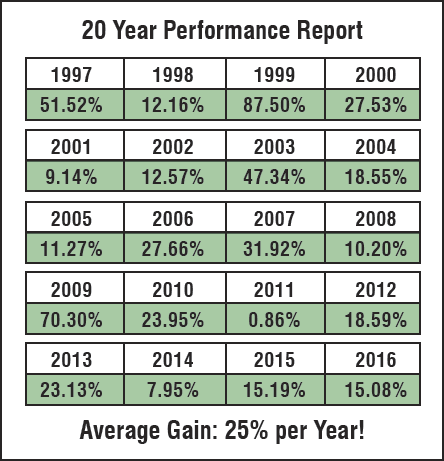
As shown in the Portfolio Simulation above, CRT-3 has shown a consistent 25%average annual return over 20 years with very low drawdowns. And, the average Profit per Trade is 1.2%! It’s one of the best RTM Methods we’ve ever seen.
Nirvana Strategy Takes Advantage of
New Connor's Indicator
Several outstanding technical analysts have shared their work, including John Bollinger (Bollinger Bands), Larry Williams (Williams %R), and most recently, Larry Connors, introducing his Connors RSI.
The Connors RSI represents a new way to calculate Relative Strength that combines Classic (Wilder’s) RSI with two additional indicators. It is this combination that transformed a good indicator into a truly great one!
Larry observed that the best chances for a Reversal occur (a) after a sequence of consecutive up or down bars and (b)when today’s Rate of Change is high compared to historical values.
The charts to the right illustrate the improvement afforded by the Connor’s RSI over Classic (Wilder’s) RSI. In the case of Classic RSI, we can see that many of the extreme “oversold” points offer good reversal opportunities, but we can also see that many of them are not generated at optimal entry points.
By contrast, the Connors RSI generates extreme oversold levels much less frequently, resulting in fewer, better trading opportunities.
Indicator Comparison
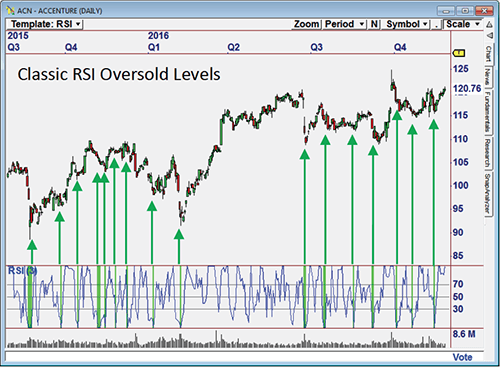
Classic (Wilder's) RSI - Oversold levels often fire "false" signals.

Connors RSI - By combining three separate indicators, oversold levels on Connor's RSI provide fewer,better trading opportunities.
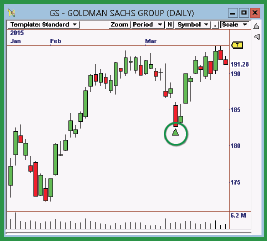
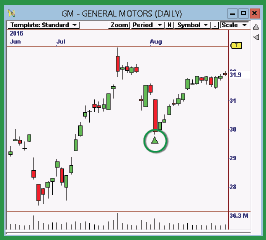
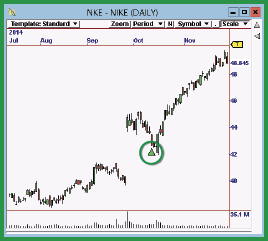
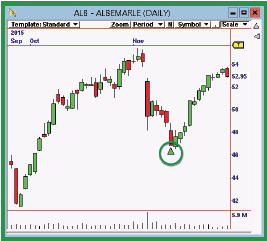
The Best Opportunities are Easy to Trade!
To the right are some recent trades generated by the CRT-3 Strategy.
The Signals generated by CRT-3 appear at optional Reversion points, making them easy to confirm and trade manually.
INCLUDED! New CRT-3
Scan generates High Probability Trades from the Entire Market
We include a special OmniScan that searches the ENTIRE MARKET for CRT-3 Setups. Using this OmniScan,you are assured of identifying every CRT-3 Opportunity, every day.