Trade with the Trend


Trade with The Trend
Find Out Why Everyone is So Excited
About the OmniTrader 2022 Upgrade Package!
OmniTrader 2022 has some AMAZING new Indicators, including Coral Trend, VIX Fix, Rotation Factor and powerful proprietary NTB Indicators!
Don't Miss Out on The Opportunity to Improve Your Trading Next Year and Beyond!
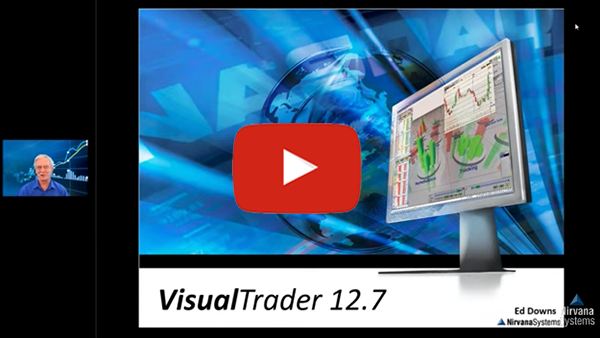
Watch Ed use OmniTrader 2022 in Real Time with the new indicators.
The NEW TrendMaster Plugin that clearly shows how to make money trading with the trend.
OmniTrader 2022 has great new additions that make finding and managing profitable trades in any market easier than ever before!
Find Out Why Everyone
is So Excited About the OmniTrader 2022
Upgrade Package!
Watch Ed use OmniTrader 2022 in Real Time with the new indicators.
OmniTrader 2022 has great new additions that make finding and managing profitable tradesin any market easier than ever before!
The NEW TrendMaster Plugin that clearly shows how to make money trading with the trend.
Don't Miss Out on The
Opportunity to Improve Your Trading Next Year
and Beyond!
"Suddenly - Making Money Just Got a Whole Lot Easier!"
OmniTrader 2022 has some great NEW additions that make finding and managing profitable trades in any market easier than ever before!
All traders know that trading in the direction of the current or new trend is very important. Making sure to exit when the trend has changed is also important. For this upgrade, we focused on features that identify trend direction better than anything we have released before!
• 3 Powerful New
Indicators
• Exciting New Innovation
for Traders
• Multiple Ease of Use
Improvements
PLUS – In the Upgrade Package:


• The NEW
OmniTrader Plug-In
that clearly shows how
to make money trading
with the trend.
I am confident that each of these great innovations is going to help you make more money in 2022 and beyond. And - the price of the OmniTrader 2022 Upgrade Package is very low! Order now and lock in your Package Deal!
Ed Downs
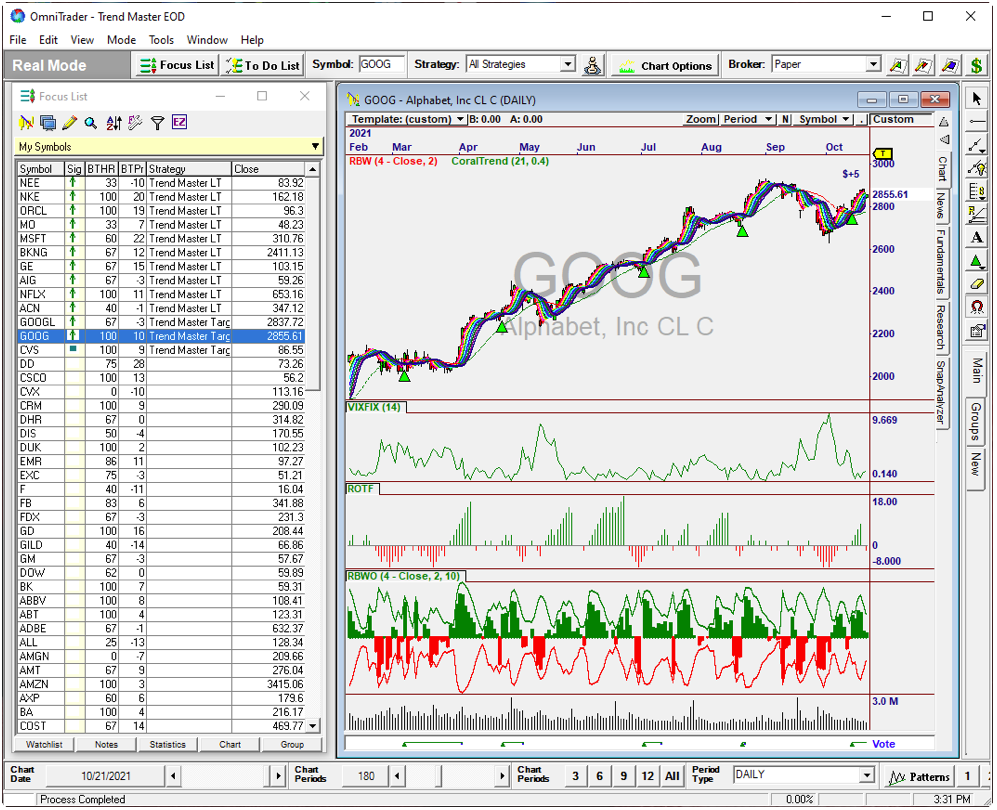


The OmniTrader Upgrade Package features Powerful New Indicators and More!
3 Powerful New Indicators Carefully
Selected to Increase Your Success.
We were thrilled when Jeff Drake, our Director of Trading Technology, researched additional indicators
and techniques that could help our users be successful. The result of his analysis is the addition of 3 powerful
new indicators that we are sure will make a big difference. I’m already using them in my trading!
Coral Trend Indicator
Keeps You Focused on the Great Trades!
(By Avoiding the Not-So-Great Ones)
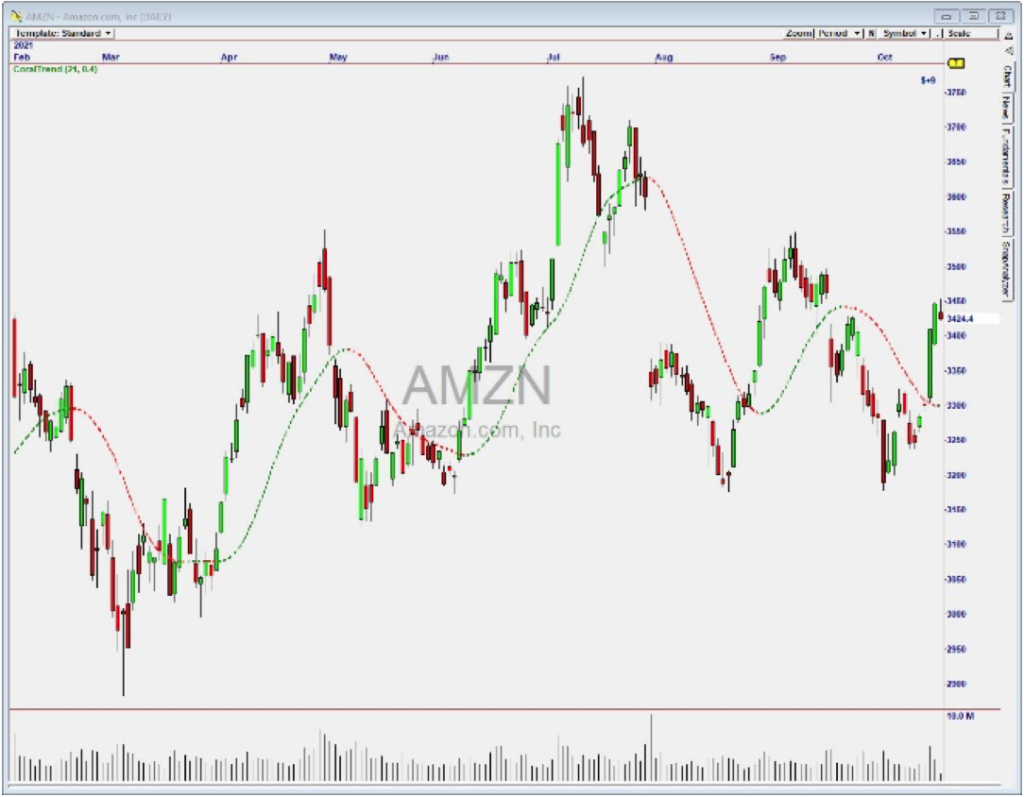

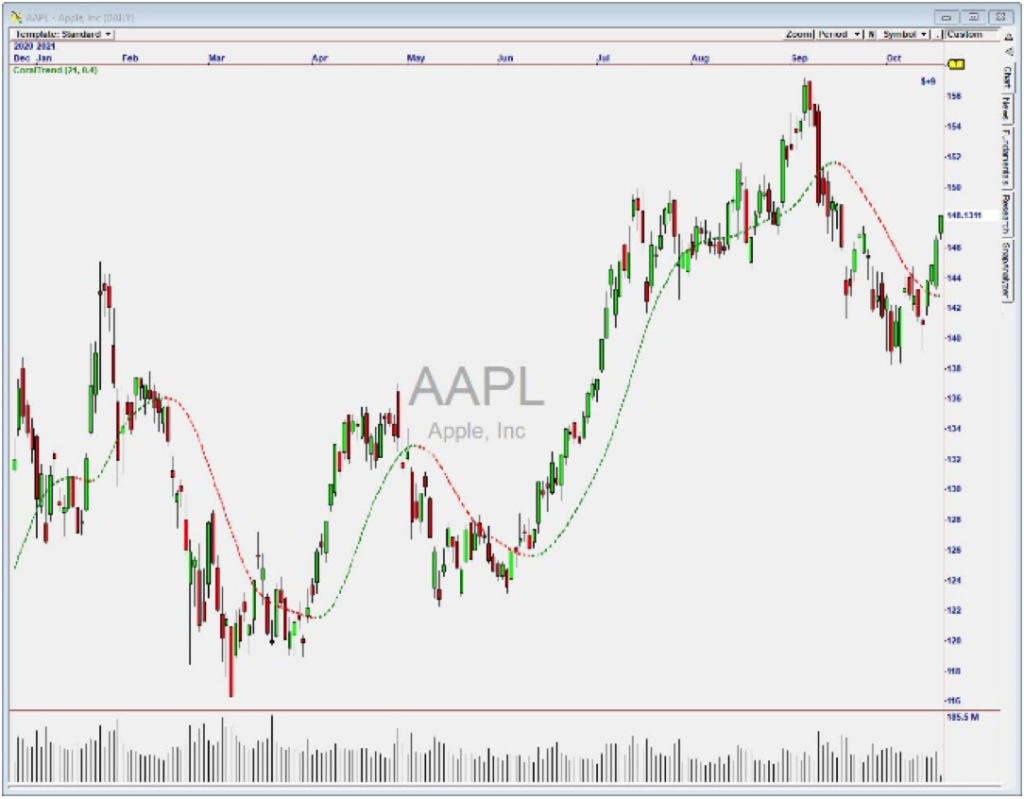

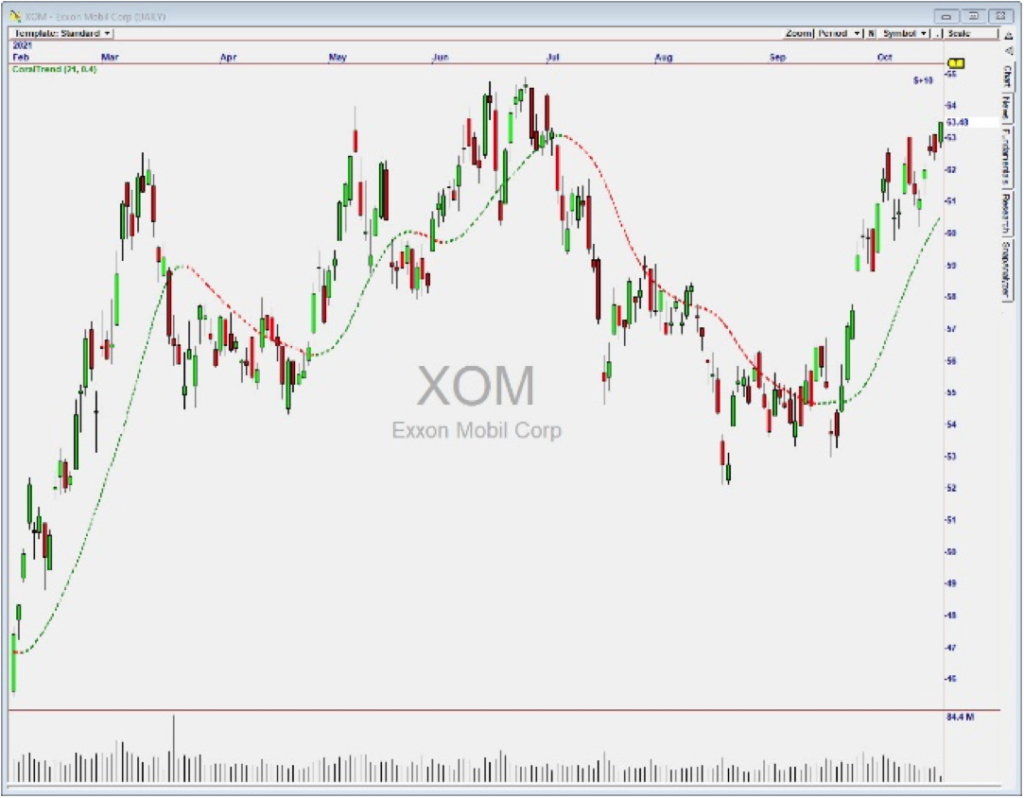

These examples beautifully demonstrate the
power of Coral Trend. The color of CTI tells you when
you’re on the Right Side of the Market!
The Coral Trend Indicator is a powerful trend-following indicator, where green represents a bullish trend and red represent a bearish trend.
In the examples to the left for Coral Trend, one can see that its red and green colors very nicely identify the current trend – even when price crosses the indicator!
When considering any trade, check the color of Coral Trend. You want to Buy in the Green Zones and Sell in the Red Zones. Nothing could be simpler. Click through the examples to see how well this amazing indicator works!
Rotation Factor
Get a Snapshot of Market Sentiment
- Letting You Know Who is in Control!
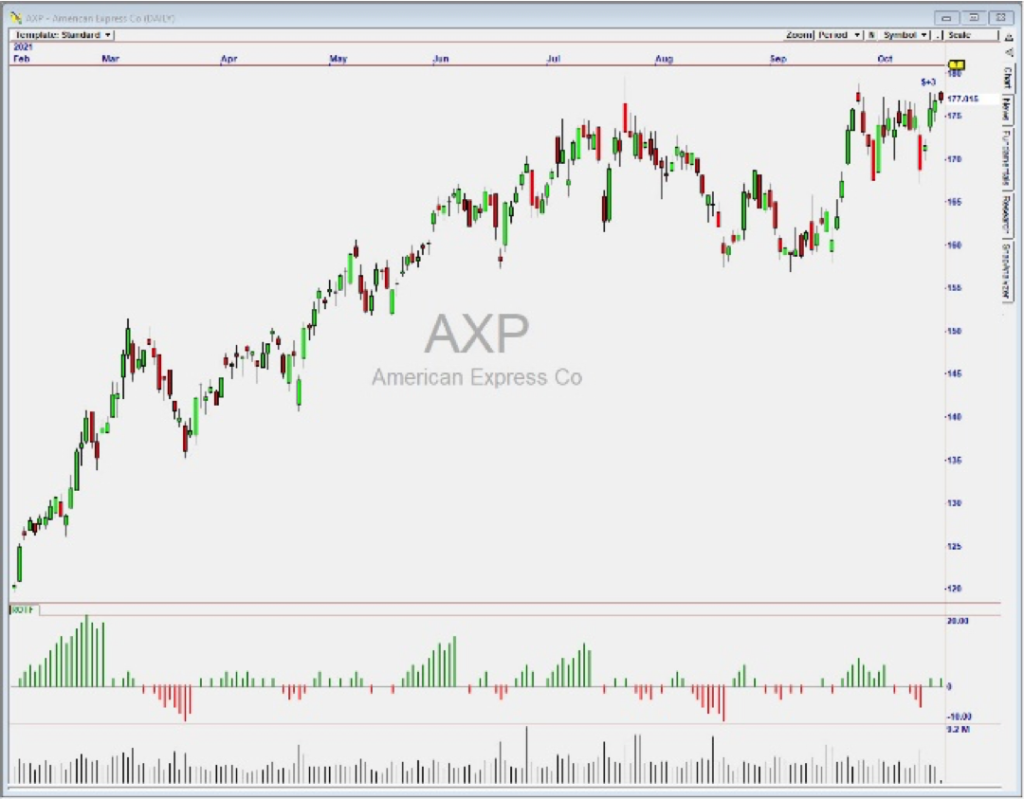

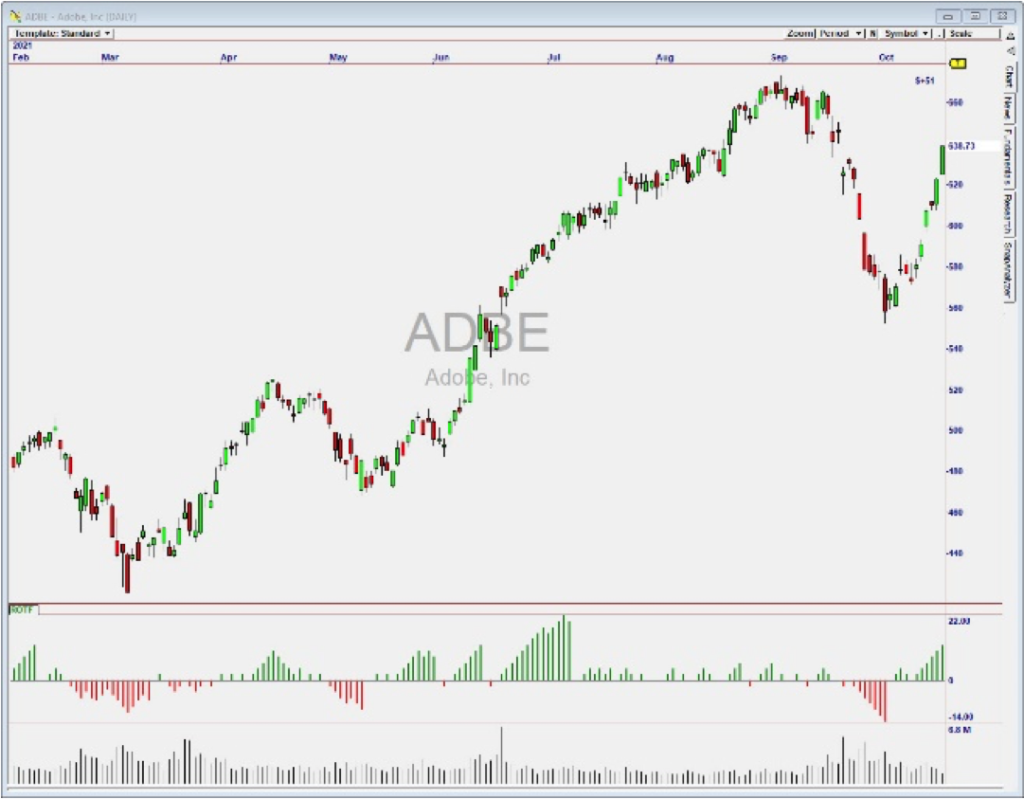

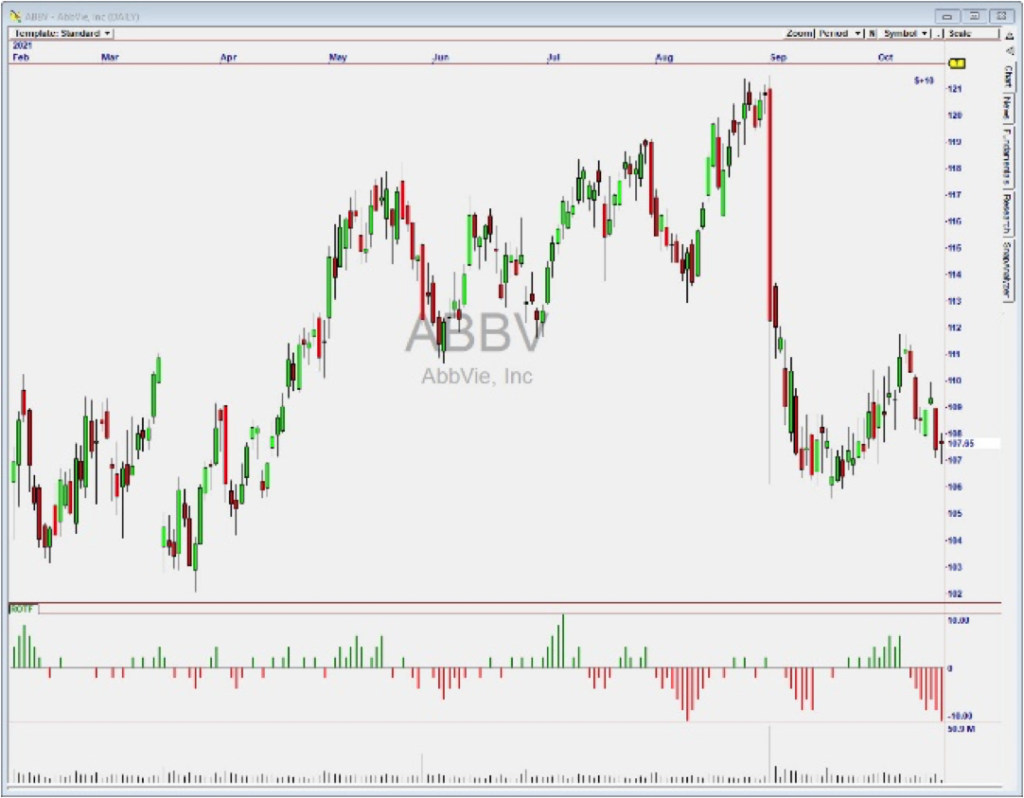

Who’s in Control? Rotation Factor shows whether
Bulls or Bears are driving the price.
The Rotation Factor is designed to show how market participants “feel” about the market they are trading. If the indicator is positive day after day, it means Buyers are in control of the market. If it continues to show a negative value every day, that means Sellers are in control.
Looking at the examples to the right, we can see that the zones of accumulation and distribution are clearly marked by sequences of red or green bars. Often, the opposite color will emerge on the day that sentiment changes and the market begins a new trend in the opposite direction.
Vix Fix
Tells You When It’s Time to Buy or Sell!
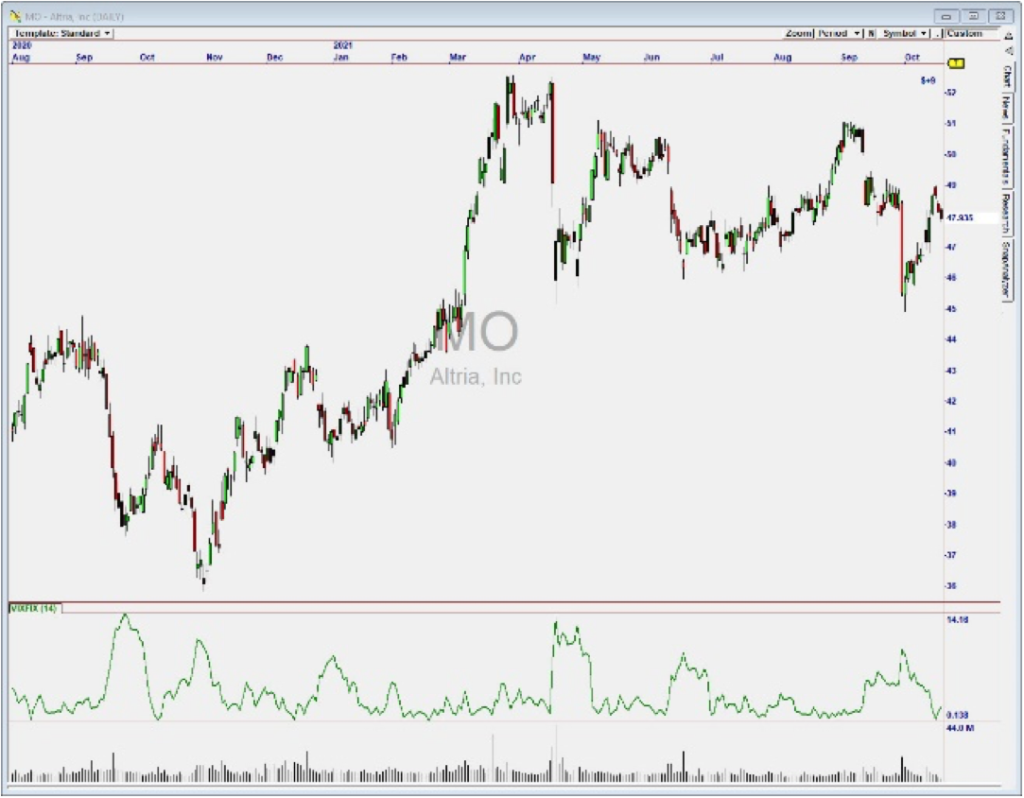

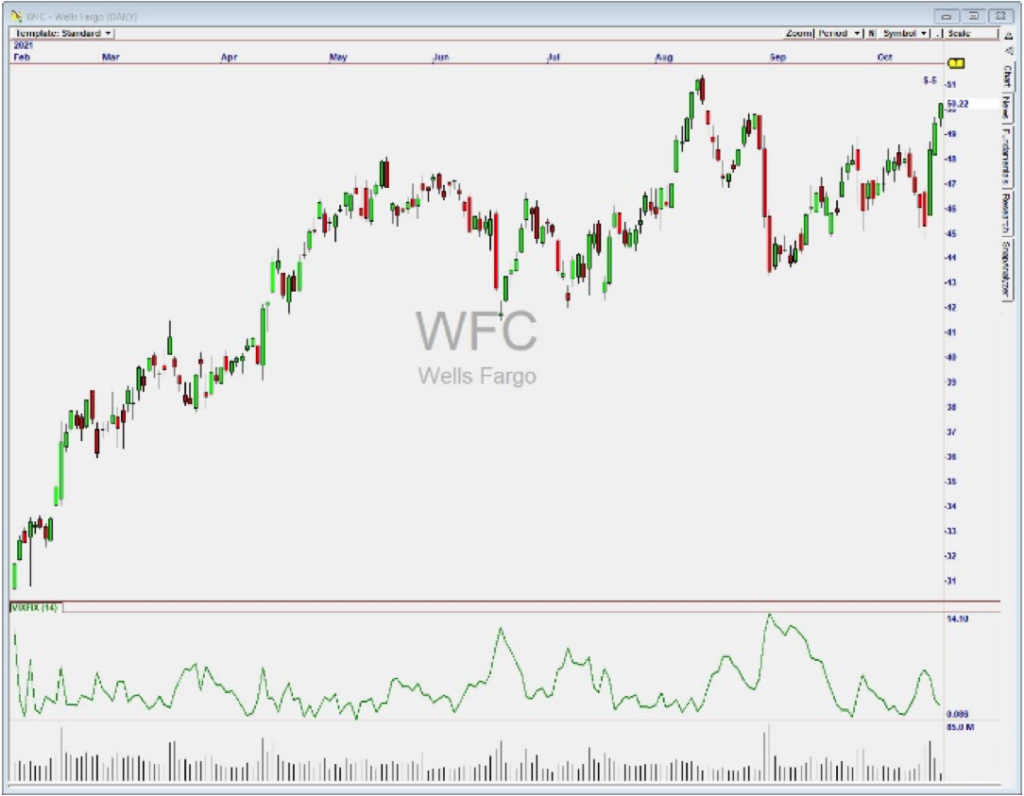

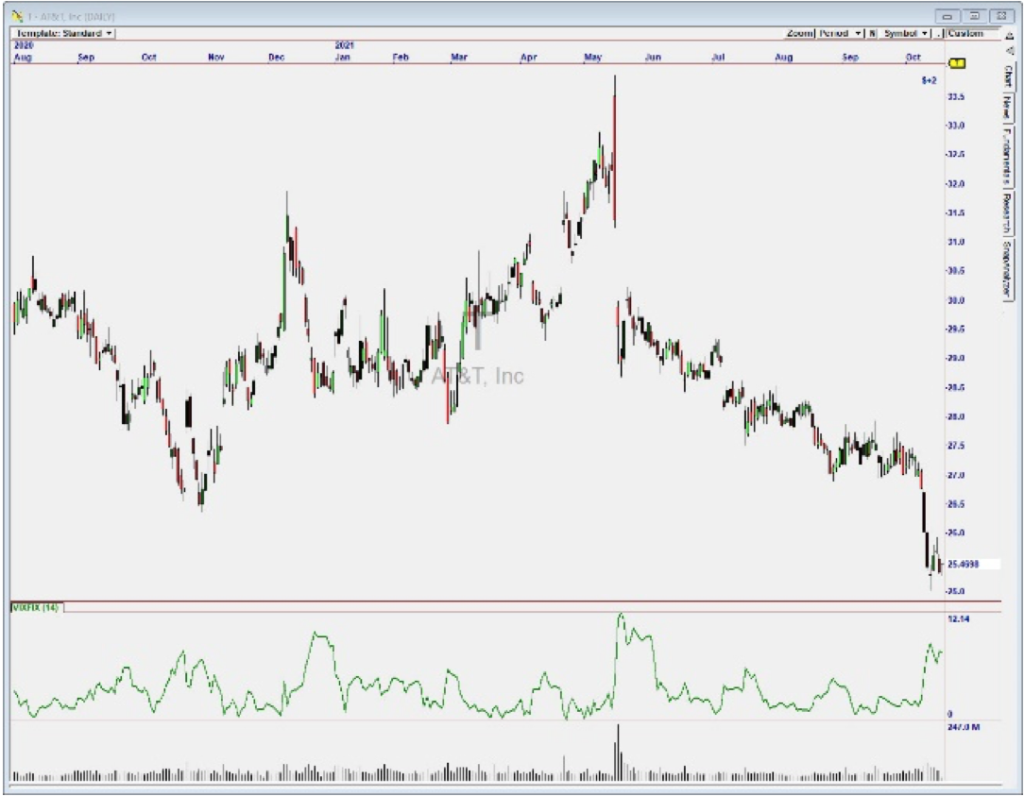

VIX Fix indicates both trending and “fearful” markets,
telling us when a market is likely to change.
The VIX Fix measures how close the current market price is to the lowest price of the last few weeks. It works because it's based on how traders behave. When prices are in uptrends, the close is usually near the high. But prices close near the low in downtrends. The calculation for VIX Fix is similar to that for the volatility index ($VIX), but fixes some of the problems inherent with classic VIX.
VIX Fix can help us determine when a market is likely to change, so we can tighten stops or reduce position size.
3 Powerful
New Indicators
We were thrilled when Jeff Drake, our Director of Trading Technology researched additional indicators and techniques that could help our users be successful. The result of his analysis is the addition of 3 powerful new indicators that we are sure will make a big difference. I’m already using them in my trading!
Coral Trend Indicator
Keeps You Focused on the Great Trades! (By Avoiding the Not-So-Great Ones)
The Coral Trend Indicator is a powerful trend-following indicator, where green represents a bullish trend and red represent a bearish trend.
In the examples below for Coral Trend, one can see that its red and green colors very nicely identify the current trend – even when price crosses the indicator!
When considering any trade, check the color of Coral Trend. You want to Buy in the Green Zones and Sell in the Red Zones. Nothing could be simpler. Click through the examples to see how well this amazing indicator works!


These examples beautifully demonstrate the power of Coral Trend. The color of CTI tells you when you’re on the Right Side of the Market!
Rotation Factor
Get a Snapshot of Market Sentiment - Letting You Know Who is in Control!
The Rotation Factor is designed to show how market participants “feel” about the market they are trading. If the indicator is positive day after day, it means Buyers are in control of the market. If it continues to show a negative value very day, that means Sellers are in control.
Looking at the examples below, we can see that the zones of accumulation and distribution are clearly marked by sequences of red or green bars. Often, the opposite color will emerge on the day that sentiment changes and the market begins a new trend in the opposite direction.


Who’s in Control? Rotation Factor shows whether
Bulls or Bears are driving price.
VIX FIX
Tells You When It’s
Time to Buy or Sell!
The VIX Fix measures how close the current market price is to the lowest price of the last few weeks. It works because it's based on how traders behave. When prices are in uptrends, the close is usually near the high. But prices close near the low in downtrends. The calculation for VIX Fix is similar to that for the volatility index ($VIX), but fixes some of the problems inherent with classic VIX.
VIX Fix can help us determine when a market is likely to change, so we can tighten stops or reduce position size.


VIX Fix indicates both trending and “fearful” markets, telling us when a market is likely to change.
Additional New Features Makes
OT Easier and More Powerful to Use!
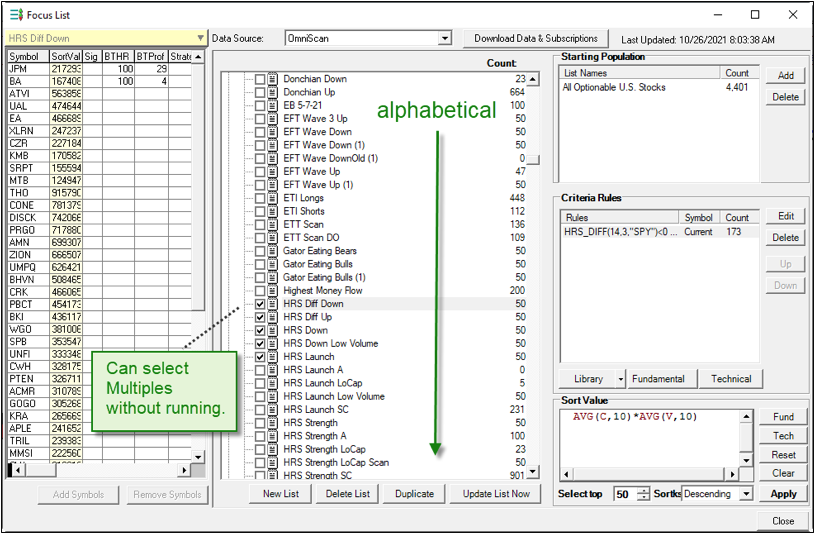
Now you can sort your scans by alphabetical and choose when you want to run it.
New Trendline Segment Drawing tool with % change so now you can see exactly what your profit will be at your designated targets!
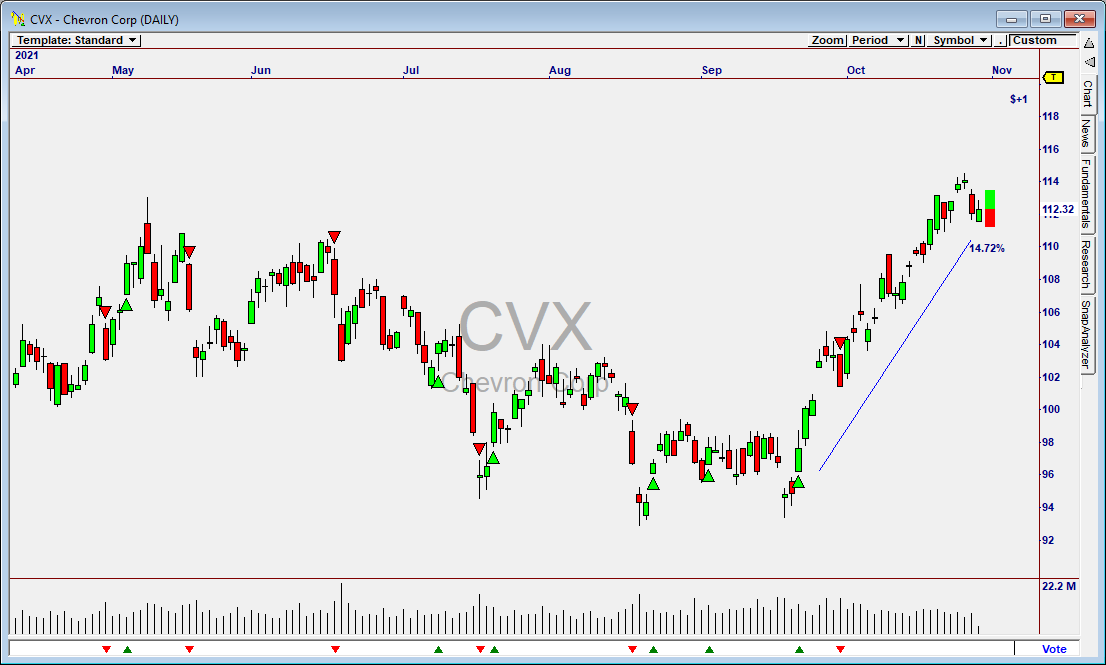
One of the most requested ease of use features for OmniTrader 2022 was the ability to set specific strategies on a specific list. Want TrendMaster to run only on a custom OmniScan – Now you can do it! In just a few clicks you get to decide which strategy runs on which list for optimal strategy performance.
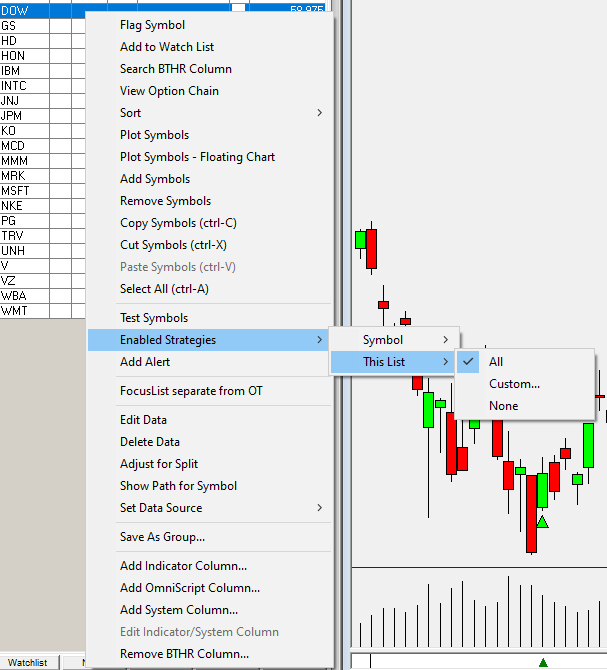
Information is one of the most important parts of your trading – that is until it
stops you from seeing the information you need! With this we have now made
it possible to view your crosshairs without displaying the Data Window.
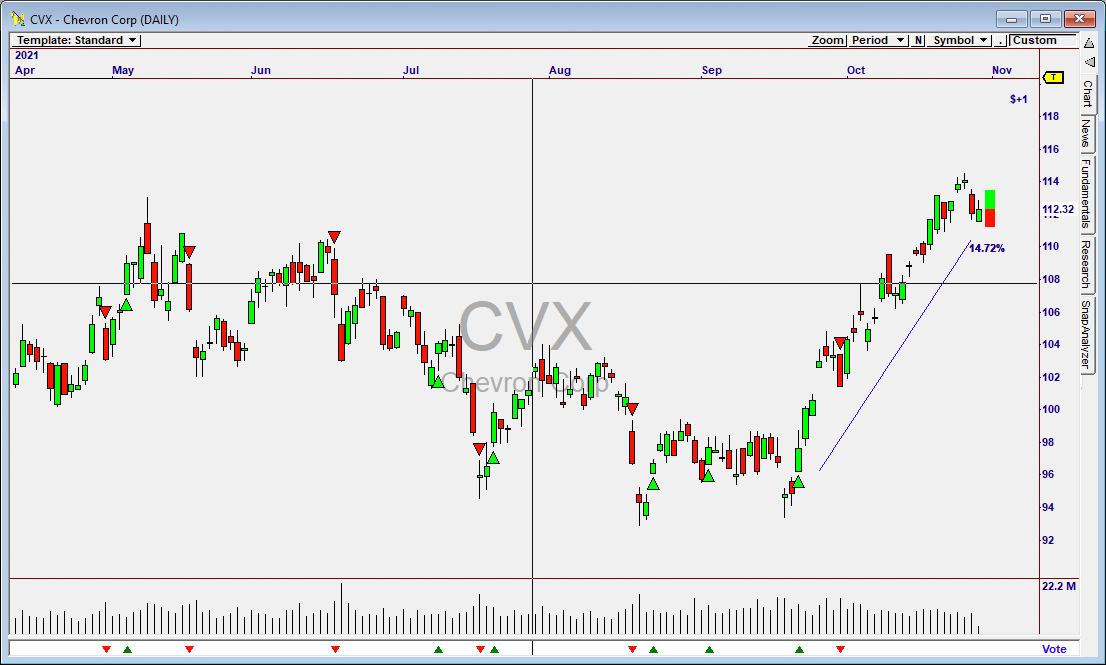
After
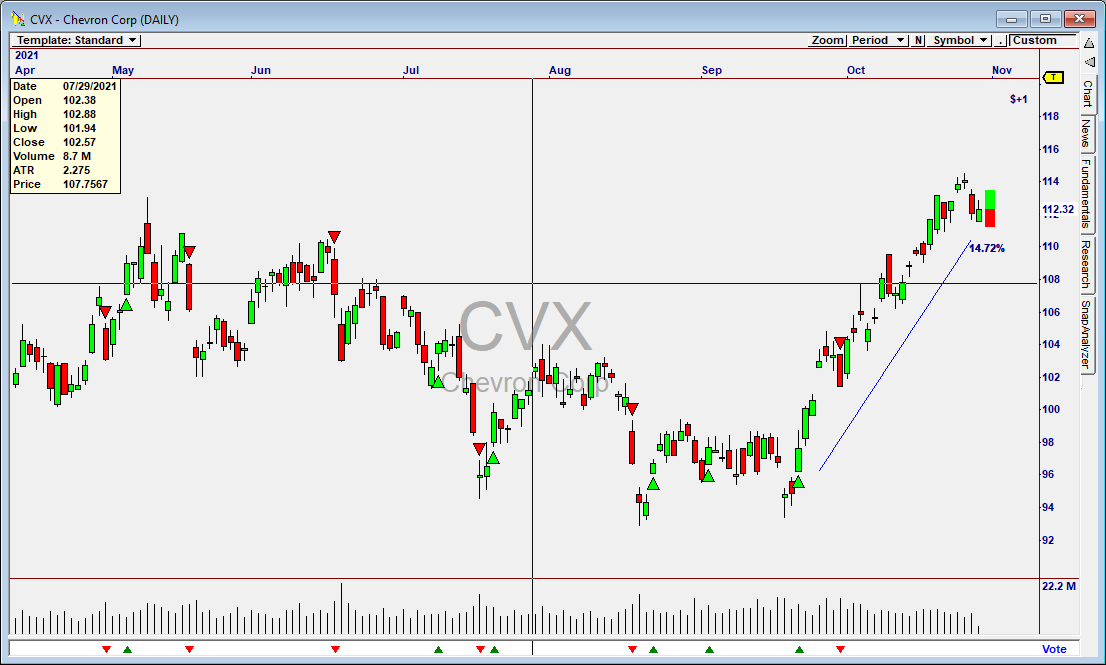
Before
As you can see – we really focused on making
OmniTrader 2022 the easiest trading platform around.


Exciting New Innovation For Traders
Only OmniTrader 2022 Has it!


Exciting New Innovation For Traders
Only OmniTrader 2022
Has it!
Stay on the Right Side of Every Trade
The addition of NTB Indicators to OmniTrader 2022 is a ground-breaking improvement that no other software has, that will help all of us stay on the right side of any trade we engage.
Each NTB Indicator displays price data based on movement, requiring a certain amount before a bar is formed, which is why they are called “Non-Time-Based.” They basically smooth out the trend so it’s easier to stay with the winning trades.
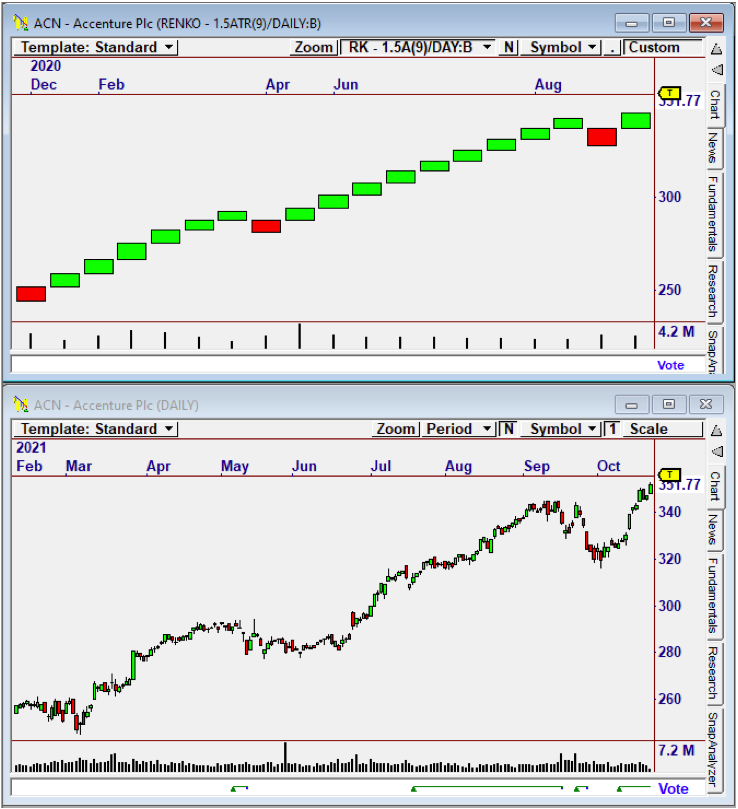


Renko vs. Price Chart shows the advantage of Renko.
To the left we see a Renko Chart and Regular Price Chart over the same time period on ACN (Accenture). We can see how the Renko Chart tends to smooth out price movement, since the changes in a Renko Chart ARE the changes in Trend.
There are additional NTB Charts that provide similar benefits. Range Charts require a minimal range of price movement to form a bar. Point & Figure Charts have been used for 100 years to detect breakouts above a support/resistance level based on a specific move size. What we asked ourselves was, "Is there a way we can improve on these valuable charting concepts?"
New Innovative Breakthrough
How It Works & Why it's so Powerful
We use Renko Charts because they show trend progression by filtering out the “wiggles” in a chart. But until now, we could only display one or the other (Renko or Price) but not BOTH in the same chart.
Introducing NTB Indicators! Below is the same Renko Chart and Price Chart. However, in this case the NEW Renko Indicator is plotted in the Price Chart.
Clearly, the ability to see the exact level where price moves through a prior Renko Bar high or low is highly-actionable information, because it shows us where we need to add to or reduce position size. With the Renko Indicator plotted, there is no need to also plot the Renko Chart.
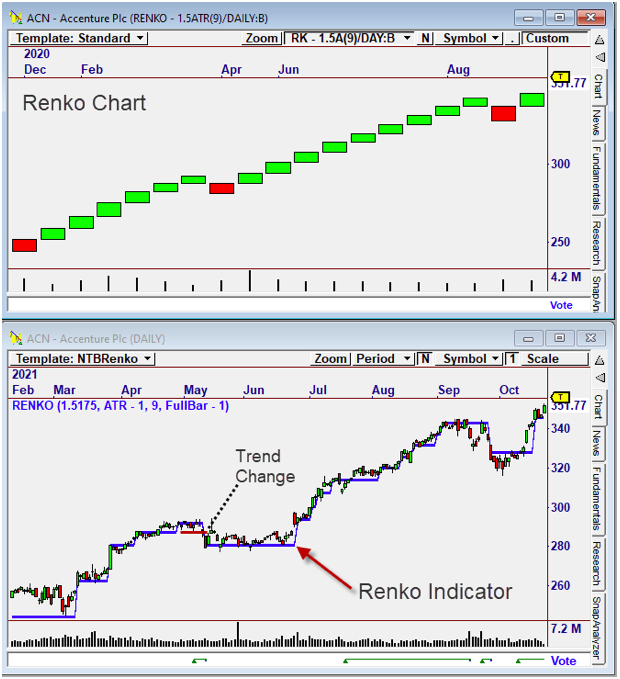


Now you can have it both ways! Here is a Renko Chart above the Price Chart with a Renko Indicator. Drops through Renko levels are easy to see.
Plotting these indicators on Price Charts provides a solid picture of the Trend, and keeps us in the market when adverse moves might cause a premature exit.
OmniTrader 2022 has indicators for all the classic NTB Chart types:
• Renko
• Range
• Point & Figure
• Three Line Break.
OmniTrader 2022 is the
ONLY trading software that
has this feature!
Stay on the Right Side of Every Trade
The addition of NTB Indicators to OmniTrader 2022 is a ground-breaking improvement that no other software has, that will help all of us stay on the right side of any trade we engage.
Each NTB Indicator displays price data based on movement, requiring a certain amount before a bar is formed, which is why they are called “Non-Time-Based.” They basically smooth out the trend so it’s easier to stay with the winning trades.
Below we see a Renko Chart and Regular Price Chart over the same time period on ACN (Accenture). We can see how the Renko Chart tends to smooth out price movement, since the changes in a Renko Chart ARE the changes in Trend.


Renko vs. Price Chart shows the advantage of Renko.
There are additional NTB Charts that provide similar benefits. Range Charts require a minimal range of price movement to form a bar. Point & Figure Charts have been used for 100 years to detect breakouts above a support/resistance level based on a specific move size. What we asked ourselves was, "Is there a way we can improve on these valuable charting concepts?"
New Innovative Breakthrough
How It Works &
Why it's So Powerful
We use Renko Charts because they show trend progression by filtering out the “wiggles” in a chart. But until now, we could only display one or the other (Renko or Price) but not BOTH in the same chart.
Introducing NTB Indicators! Below is the same Renko Chart and Price Charts. However, in this case the NEW Renko Indicator is plotted in the Price Chart.
Clearly, the ability to see the exact level where price moves through a prior Renko Bar high or low is highly-actionable information, because it shows us where we need to add to or reduce position size. With the Renko Indicator plotted, there is no need to also plot the Ranko Chart.
Plotting these indicators on Price Charts provides a solid picture of the Trend, and keeps us in the market when adverse moves might cause a pre-maturely exit. OmniTrader 2022 has indicators for all the classic NTB Chart types:
• Renko
• Range
• Point & Figure
• Three Line Break.
OmniTrader 2022 is the
ONLY trading software that has this feature!


Now you can have it both ways! Here is a Renko Chart above Price Chart with a Renko Indicator. Drops through Renko levels are easy to see.
Introducing...


Since the OmniTrader 2022 theme is “Trade with the Trend!” there is
no better Plug-In to complement the Upgrade than TrendMaster.
Introducing...


Since the OmniTrader 2022 theme is “Trade with the Trend!” there is no better Plug-In to complement the Upgrade than TrendMaster.
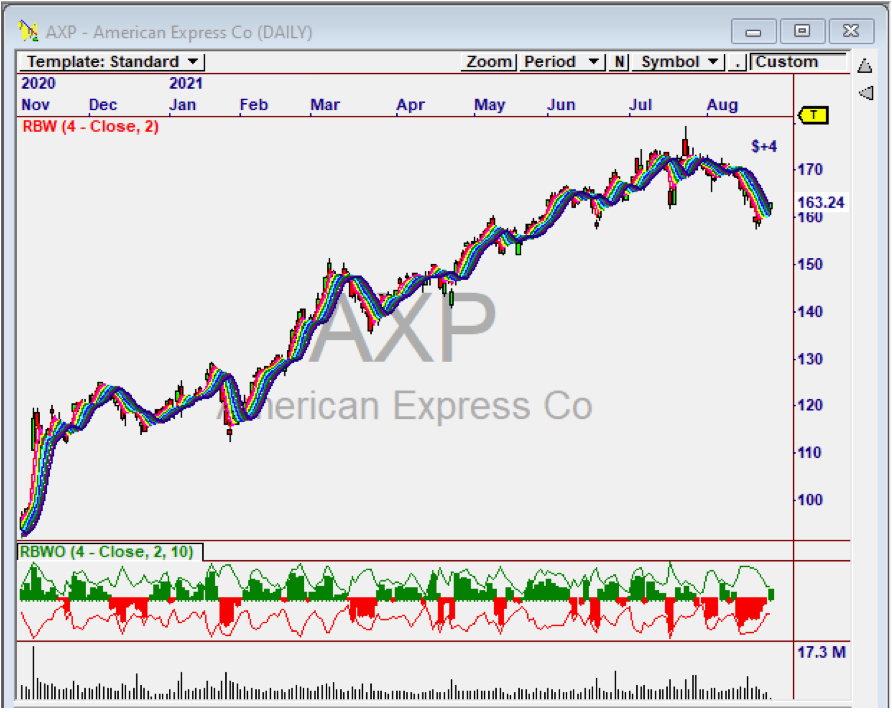


TrendMaster is based on the Rainbow Indicator, which is named for the
multi-colored “ribbon” that overlays the chart shown here on AXP.
Harness the Power of the Rainbow and
Find Your Trading Pot of Gold!
Why It’s So Powerful
The Rainbow Indicator is based on a unique “recursively smoothed” Moving Average. In fact, nine separate Moving Averages are calculated to determine Consensus of Trend and Change in Trend.
In the chart to the right, we can see the “Rainbow” turning with Trend to provide a clear visual cue as to the strength of the turn.
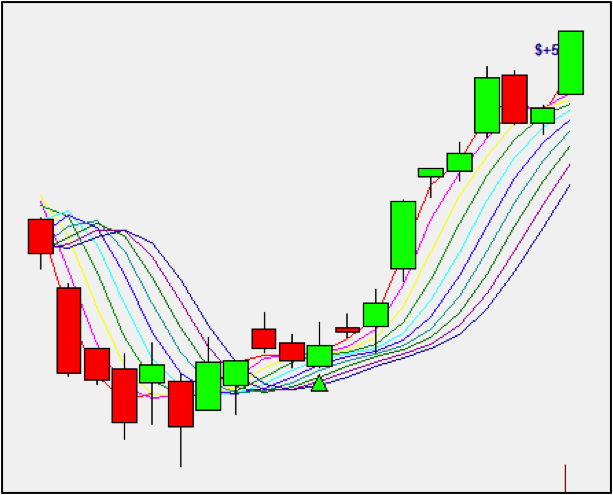


The Rainbow Oscillator – Powerful Signals from the Rainbow Indicator
The Rainbow Oscillator uses the same information as the Rainbow Indicator, but with additional calculations to show potential changes in trend. The oscillator can be used to produce buy and sell signals, as well as determine overbought and oversold levels.
As the Oscillator grows in width, the current trend is increasing its intensity. However, if the value of the oscillator goes beyond 80, the market becomes more and more unstable, meaning we need to watch for a sudden reversal. When the oscillator becomes more and more flat, the market tends to remain more stable and the bands narrow to confirm this.
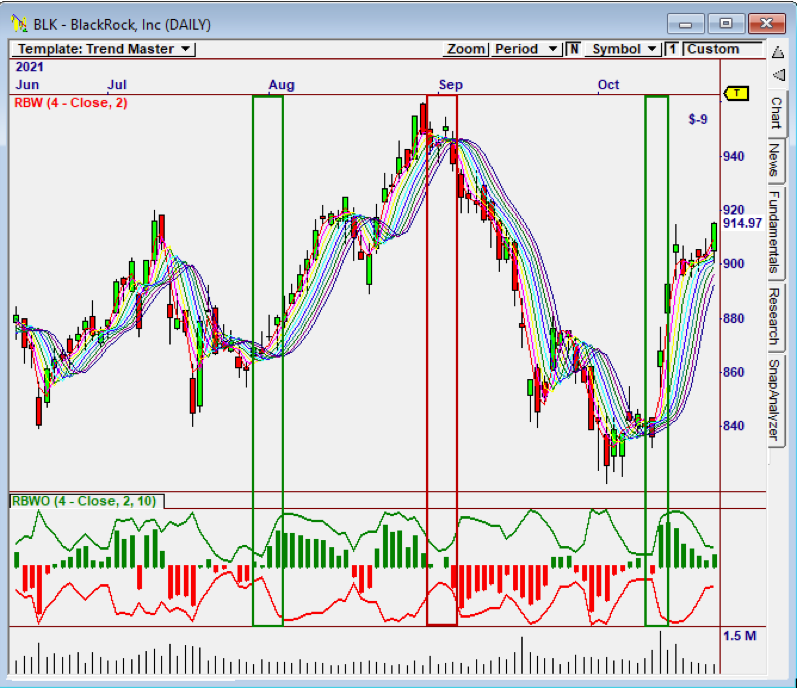


BLK shows where the Indicator tightened
and expanded at reversals.
Conversely, if the oscillator goes below 20, the market is also prone to sudden reversals. Therefore, the best indication of a stable trend is when the oscillator is between 20 and 80. In addition, the depth a certain price has on a chart into the rainbow can be used to judge the strength of the move.
The TrendMaster Strategy
Mechanically Profitable with 70% Accuracy in the Past Year!


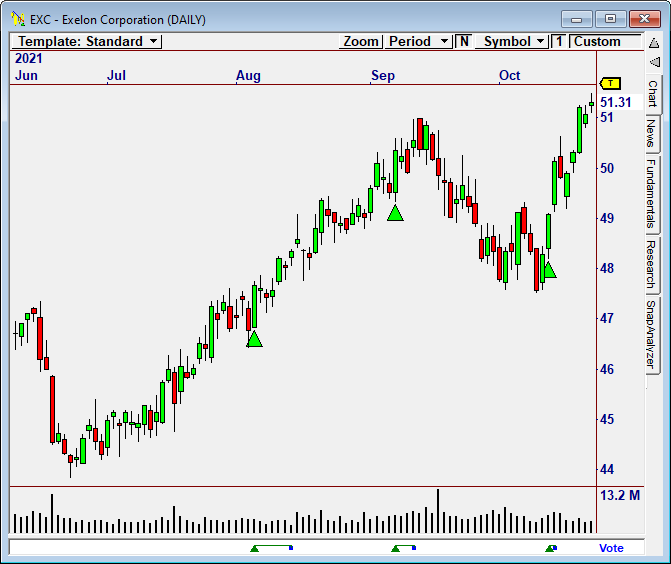


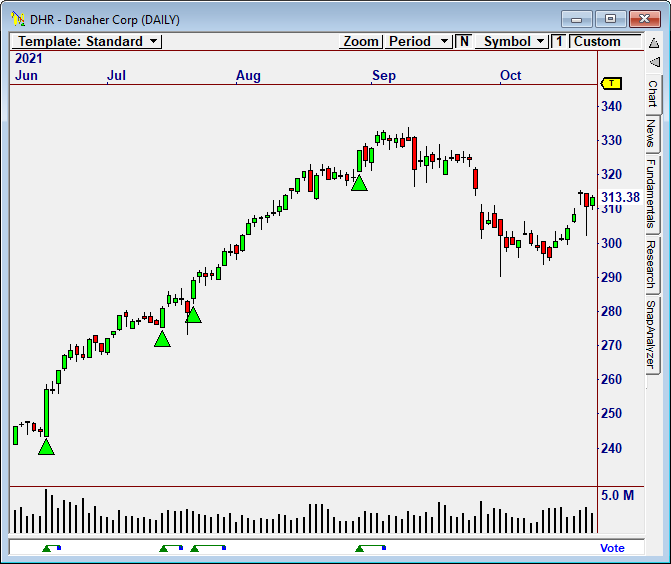


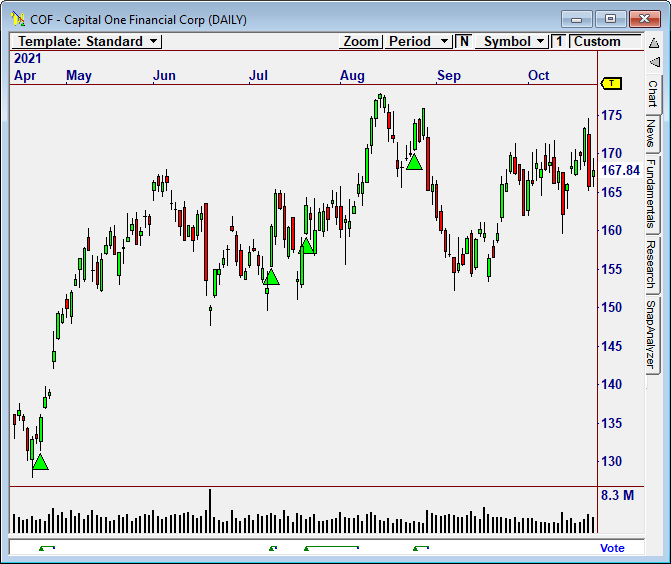


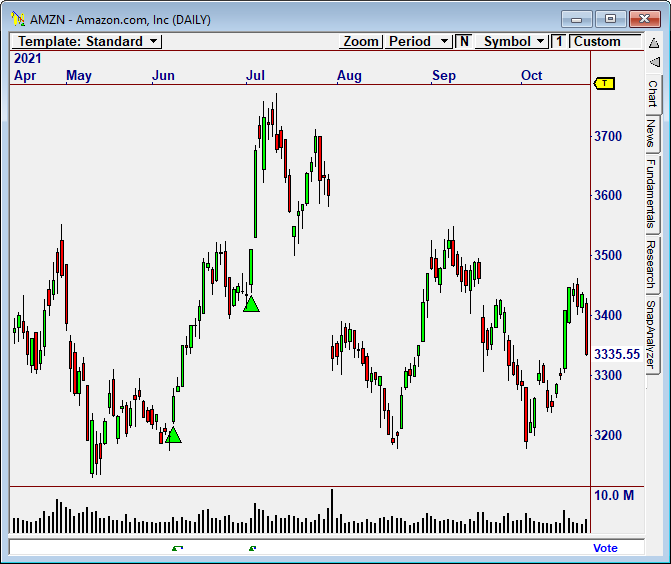


Signals generated by the NEW TrendMaster Strategy!
Using the predictive nature of the Rainbow Oscillator, Jeff created an excellent Strategy. The following examples clearly show its trading acumen.
YES, the Signals and Exits from the Strategy are mechanically profitable! In fact, they’ve been over 70% accurate in the past year. To our knowledge, nobody has created a Mechanical Strategy from the Rainbow concept, until now!


Find Your Trading Pot of Gold IN the Rainbow!
The TrendMaster plugin for OmniTrader 2022 will include The TrendMaster Advantage, a special seminar designed to provide you with all of the information you need to become a true trend master.
In this comprehensive seminar you will learn
• How the Rainbow Indicator is Constructed
• Why the Rainbow is Used by Traders in Every Market
• How the Rainbow Oscillator is Used for Entries AND Exits
• Why the TrendMaster Strategies are So Accurate and Profitable
• How to Visually Confirm Trades with the Rainbow
• How the Rainbow Shows You Trend Direction and Strength
The TrendMaster Advantage gives you everything you need to
harness the power of the Rainbow and find your trading pot of gold!


TrendMaster is based on the Rainbow Indicator, which is named for the multi-colored “ribbon” that overlays the chart shown here on AXP.
Harness the Power
of the Rainbow and
Find Your Trading
Pot of Gold!
Why It’s So Powerful
The Rainbow Indicator is based on a unique “recursively smoothed” Moving Average. In fact, nine separate Moving Averages are calculated to determine Consensus of Trend and Change in Trend.
In the chart to the right, we can see the “Rainbow” turning with Trend to provide a clear visual cue as to the strength of the turn.


The Rainbow Oscillator – Powerful Signals from the Rainbow Indicator
The Rainbow Oscillator uses the same information as the Rainbow Indicator, but with additional calculations to show potential changes in trend. The oscillator can be used to produce buy and sell signals, as well as determine overbought and oversold levels.
As the Oscillator grows in width, the current trend is increasing its intensity. However, if the value of the oscillator goes beyond 80, the market becomes more and more unstable, meaning we need to watch for a sudden reversal. When the oscillator becomes more and more flat, the market tends to remain more stable and the bands narrow to confirm this.
Conversely, if the oscillator goes below 20, the market is also prone to sudden reversals. Therefore, the best indication of a stable trend is when the oscillator is between 20 and 80. In addition, the depth a certain price has on a chart into the rainbow can be used to judge the strength of the move.


BLK shows where the Indicator tightened and expanded at reversals.
The TrendMaster Strategy
Mechanically Profitable
with 70% Accuracy in
the Past Year!


Signals generated by the NEW TrendMaster Strategy!
Using the predictive nature of the Rainbow Oscillator, Jeff created an excellent Strategy. The following examples clearly show its trading acumen.
YES, the Signals and Exits from the Strategy are mechanically profitable! In fact, they’ve been over 70% accurate in the past year. To our knowledge, nobody has created a Mechanical Strategy from the Rainbow concept, until now!


Find Your Trading
Pot of Gold IN
the Rainbow!
The TrendMaster plugin for OmniTrader 2022 will include The TrendMaster Advantage,
a special seminar designed to provide you with all of the information you need to become a true trend master.
In this comprehensive seminar you will learn
• How the Rainbow Indicator is Constructed
• Why the Rainbow is Used by Traders in Every Market
• How the Rainbow Oscillator is Used for Entries AND Exit
• Why the TrendMaster Strategies are So Accurate and Profitable
• How to Visually Confirm Trades with the Rainbow
• How the Rainbow Shows You Trend Direction and Strength
The TrendMaster Advantage gives you everything you need to
harness the power of the Rainbow and find your trading pot of gold!


OmniTrader 2022 is truly one of the best upgrades we have ever created. I am already using the indicators that Jeff Drake created with the help of our developers. And they are FABULOUS.
This upgrade has NTB Indicators. Just plotting them will definitely give you an edge, because they show where trend is changing. Then, there is the incredible TrendMaster plug in. This new set of Indicators and Strategy is worth more than words can convey. They will absolutely help you get “in the trading profit zone” - day after day.
The OmniTrader 2022 upgrade is priced very low. And the Package is an extra special deal (if you order before the deadline!). Review the web page and all that OmniTrader 2022 has to offer. I think it’s an easy decision.
All of us here at Nirvana Systems appreciate your support.
Sincerely,
Ed Downs
Order Today
OmniTrader 2022 Upgrade..............................Just $249
Complete with...
• NTB Indicators
• Numerous Usability Enhancements
TrendMaster Plugin..........................Priced at Just $449
Know the Trend and find trades compatible with it.
• New Rainbow Indicator and Oscillator
• New TrendMaster MECHANICAL Strategies
• Special Seminar by Jeff Drake explaining usage
OmniTrader 2022 Upgrade Package: Just $495
OmniTrader 2022 is truly one of the best upgrades we have ever created. I am already using the indicators that Jeff Drake created with the help of our developers. And they are FABULOUS.
This upgrade has NTB Indicators. Just plotting them will definitely give you an edge, because they show where trend is changing. Then, there is the incredible TrendMaster plug in. This new set of Indicators and Strategy is worth more than words can convey. They will absolutely help you get “in the trading profit zone” - day after day.
The OmniTrader 2022 upgrade is priced very low. And the Package is an extra special deal (if you order before the deadline!). Review the web page and all that OmniTrader 2022 has to offer. I think it’s an easy decision.
All of us here at Nirvana Systems appreciate your support.
Sincerely,
Ed Downs
Order Today
OmniTrader 2022 Upgrade..... $249
Complete with...
• NTB Indicators
• Numerous Usability Enhancements
TrendMaster Plugin.........$449
Know the Trend and find trades compatible with it.
• New Rainbow Indicator and Oscillator
• New TrendMaster MECHANICAL Strategies
• Special Seminar by Jeff Drake explaining usage
OmniTrader 2022 Upgrade Package:
Just $495
Our software is backed by our unconditional Money Back Guarantee. If for any reason you are not fully satisfied, you may return the software, within 30 days of purchase, for a 100% refund, less shipping and handling. Texas residents add 8.25% sales tax. Educational material is non-refundable.
Important Information: Futures, options and securities trading has risk of loss and may not be suitable for all persons. No Strategy can guarantee profits or freedom from loss. Past results are not necessarily indicative of future results. These results are based on simulated or hypothetical performance results that have certain inherent limitations. Unlike an actual performance record, simulated results do not represent actual trading. There are numerous market factors, including liquidity, which cannot be fully accounted for in the preparation of hypothetical performance results all of which can adversely affect actual trading results. No representation is being made that any account will or is likely to achieve profits or losses similar to these being shown.


