


We're Changing the Way
Traders See the Market
We're Changing the Way
Traders See the Market
Understanding the Map
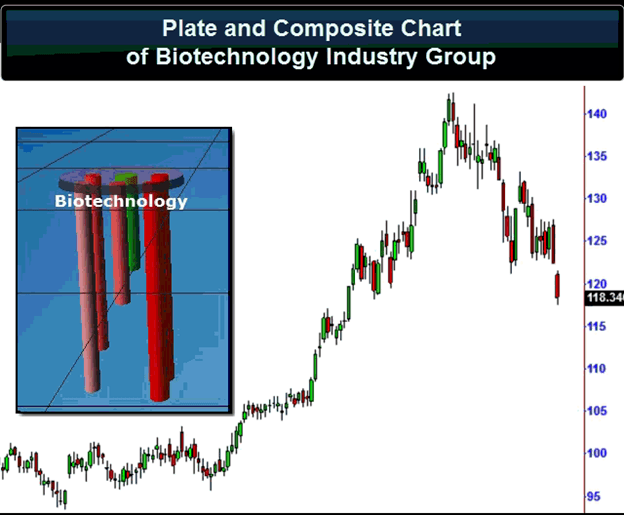
When you first start VisualTrader, the first thing you see is the 3D map of the market. The Map consists of cylinders and plates. Each cylinder represents an individual security, and the plate that a cylinder rests on represents the security's industry group. This organizational structure makes it easy to see and understand movements in the market.
The map also serves as a way to navigate through the market data. When you click a cylinder or plate, it brings up the chart for the individual stock or the composite chart for the group. This allows you to easily jump to the best opportunities without having to sort through endless lists.
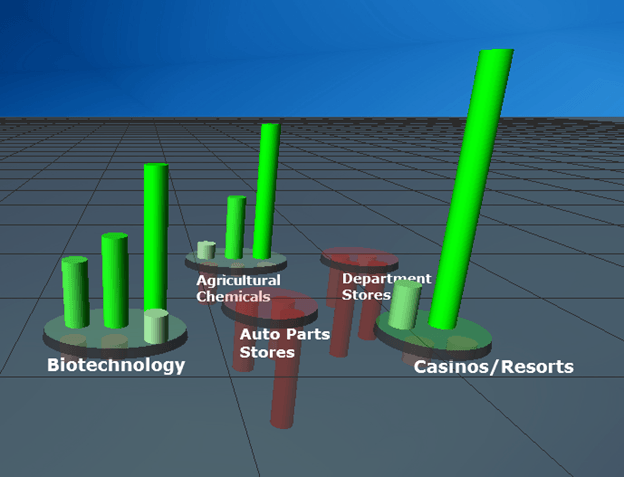
The visual presentation of data makes it easy to see strength and weakness in the market.
The Measurement Concept
The VisualTrader Map display is based on measurements. A measurement can be any dynamic indication of movement, such as Trend, Change in Trend, Change in Volume, Volatility, Price Change, or any other formula based on price information. In the map, cylinders depict the values of measurements by assigning them to Height, Width, and Color. This visualization provides a clear picture of what the market is doing.
With VisualTrader's measurements, it is easy to identify profitable situations. For example, if most of the cylinders are red, but one Industry Group is starting to turn green, that group is likely to be the leader in a new rally. VisualTrader gives you the Big Picture!
A popular visualization is the Trend with Changes in Trend. It depicts the strength of the current trend as the height of each cylinder. For the colors, it measures the acceleration which tends to lead the movements in the underlying stock. The coloration helps you stay ahead of the market, by instantly showing emerging strength and weakness across the entire map.
Measurements make it easy to see the strength and weakness of stocks and groups across the entire market.
VisualTrader is a Charting Powerhouse
True market visibility requires seeing both the Big Picture and the individual details. That's why we built VisualTrader to have the world's most robust charting tools. With access to more than 150 technical indicators and systems, VisualTrader gives you extensive chart studies, allowing you to understand every bar of every chart in the market. The charts are fully configurable, offering interactive alerts, automated trendlines, and more. These tools are designed with one purpose: to bring the best analysis to your fingertips.
VisualTrader's analysis also includes preconfigured trading strategies that let you automate your analysis and pinpoint trading opportunities, just like the pros do. The strategies generate actionable buy and sell signals that are then displayed on both the chart and the map. You can even build your own trading strategies, with our easy-to-use strategy flowcharts. No other platform offers this level of analysis and configurability.
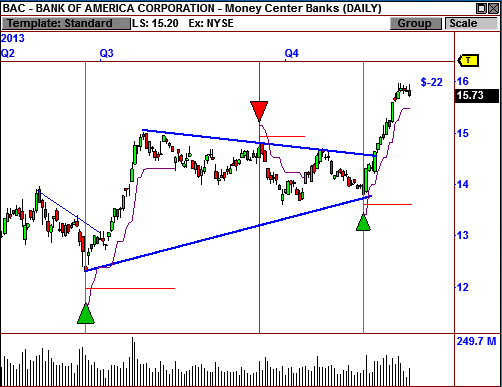
VisualTrader provides advanced analysis and charting tools to help you identify the best trading opportunities.
VisualTrader is a Charting Powerhouse
True market visibility requires seeing both the Big Picture and the individual details. That's why we built VisualTrader to have the world's most robust charting tools. With access to more than 150 technical indicators and systems, VisualTrader gives you extensive chart studies, allowing you to understand every bar of every chart in the market. The charts are fully configurable, offering interactive alerts, automated trendlines, and more. These tools are designed with one purpose: to bring the best analysis to your fingertips.
VisualTrader's analysis also includes preconfigured trading strategies that let you automate your analysis and pinpoint trading opportunities, just like the pros do. The strategies generate actionable buy and sell signals that are then displayed on both the chart and the map. You can even build your own trading strategies, with our easy-to-use strategy flowcharts. No other platform offers this level of analysis and configurability.
VisualTrader provides advanced analysis and charting tools to help you identify the best trading opportunities.
Trade Management Made Easy
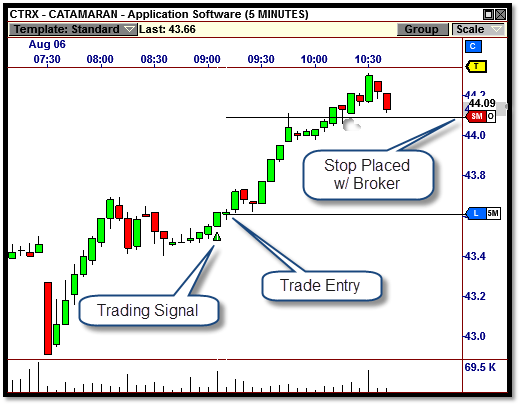
Once VisualTrader has brought the best trades to your attention, you can easily engage the market by trading directly in VisualTrader's charts. You can enter a trade with only a few mouse clicks, and once you are in a trade, you can manage your position in the chart as well.
Regardless of whether you trade during market hours or after the market has closed, VisualTrader shows you all the information you need to make profitable trading decisions. No other trading software makes it this easy to make money.
Total Integration
With VisualTrader's integrated Brokerage, you never have to leave the platform. The feature lets you trade directly from the charts without missing a beat. This keeps all of your information in one place, so there's no more fumbling between apps trying to keep your trades in sync.
Our trade management tools allow you to access all of your orders, directly in the chart. To adjust a stop or limit level, drag the chevron to the new value. Need a new stop? Pull down a new chevron. Trade Management has never been this easy.
The Integrated Brokerage feature works with a number of select brokers offering low commissions and lightning fast executions. There's even a built-in paper broker and trading simulator to let you practice your trading without risking a dime. It's details like this that make VisualTrader the most profitable view of the market ever created!
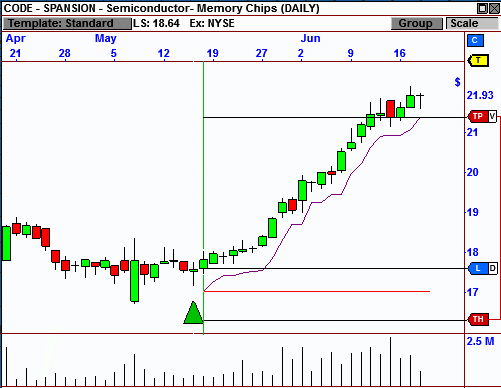
VisualTrader's integrated brokerage makes trade management easy.
Total Integration
With VisualTrader's integrated Brokerage, you never have to leave the platform. The feature lets you trade directly from the charts without missing a beat. This keeps all of your information in one place, so there's no more fumbling between apps trying to keep your trades in sync.
Our trade management tools allow you to access all of your orders, directly in the chart. To adjust a stop or limit level, drag the chevron to the new value. Need a new stop? Pull down a new chevron. Trade Management has never been this easy.
The Integrated Brokerage feature works with a number of select brokers offering low commissions and lightning fast executions. There's even a built-in paper broker and trading simulator to let you practice your trading without risking a dime. It's details like this that make VisualTrader the most profitable view of the market ever created!
VisualTrader's integrated brokerage makes trade management easy.