


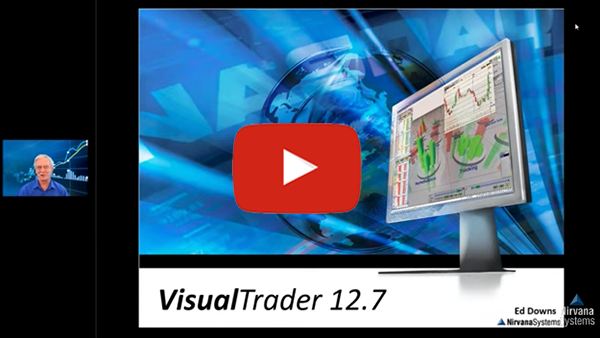


Ten Hot Features That
Maximize Your Trading Potential
Ten Hot Features That
Maximize Your Trading Potential
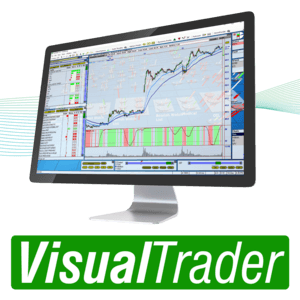
The VisualTrader Trading Platform is Loaded with
Features to Help You Maximize Every Trade.
Here are ten of the most powerful features included with your VisualTrader purchase.
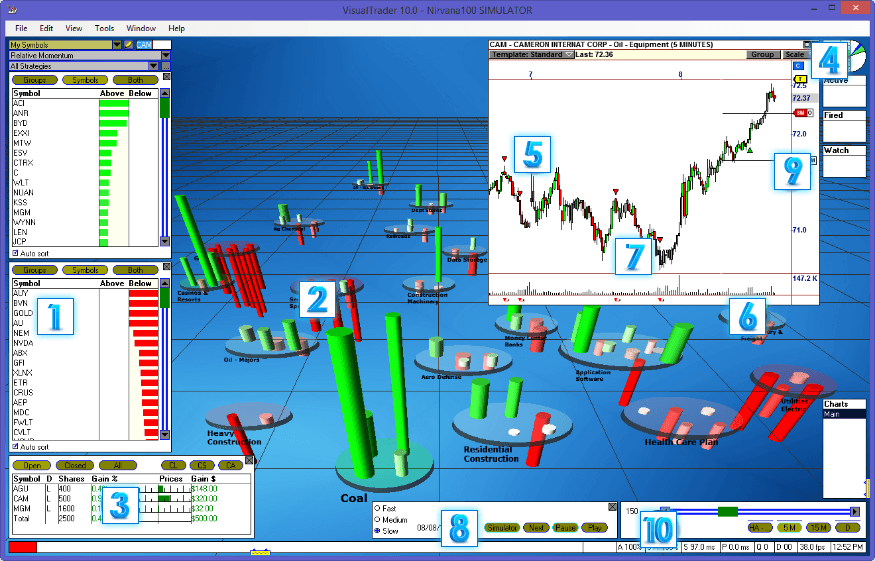

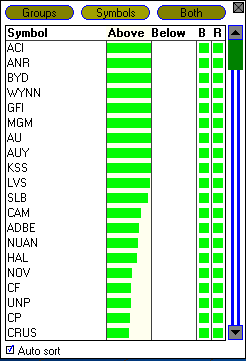
The Visual List makes it easy to see what stocks are currently strongest and weakest in the market. Two separate lists allow you to see the most bullish stocks and the most bearish stocks at once. The Auto Sort feature will continue to evaluate the stocks and bring the best candidates to the top of the Lists.

Strength and weakness in the market are easy to see in the VisualTrader map. Stocks are organized by their industry group, allowing you to see which groups are leading the market. The map allows you to see overall market sentiment at a glance.

The Visual Brokerage feature lets you see how all of your open positions are performing without taking your eye off of the market. Positions can be managed directly from the Visual Brokerage window, giving you the ability to make quick trading decisions and allowing you to keep a watchful eye on your portfolio.

Be alerted to major moves in the market with the Leading Indicator. This unique display shows you not only where the market has been, but it also shows you the strength of the current move

VisualTrader offers multiple chart tools to help you maximize the potential of every trade. Create alerts using various line studies, plot any of the over 120 indicators, or create a color chart based off of any idea you might have.

VisualTrader provides you with the most advanced chart pattern recognition technology in the market. Support/Resistance, Trendlines, and Fibonacci Retracements are applied to all of the stocks in your map. Once a pattern is detected you will be notified in the list so that you can take advantage of the opportunity.

Trading Strategies are provided in VisualTrader that will signal you to Reversal, Breakout and Trending opportunities. Have an idea of your own? Trading Strategies are fully customizable, and VisualTrader's Strategy Builder feature makes strategy design easier than any other software on the market.

Practice trading with VisualTrader by using the Playback and Simulator feature. Simply pull the slider back to a historical point and press play to see a "play back" of the market. As you see opportunities unfold, you can practice trading in a paper account, allowing you to hone your skills for the real market.

VisualTrader lets you trade with your broker directly through the charts. You can place orders with just a click of the mouse, and you can even apply one of our provided Trade Plans in order to manage the trade to an optimal outcome.

Looking at the Map, List, and all VisualTrader analysis in different time frames is effortless with the Time Frame Toggle feature. Choose a time frame, and VisualTrader will automatically switch all analysis to the selected periodicity.
VisualTrader is loaded with features to help you maximize every trade. Below we
highlight ten of the most powerful features included with your VisualTrader purchase.

Visual List
The Map
Visual Brokerage
Leading Indicator
Dynamic Charting Features
Automated Chart Patterns
Trading Strategies
Trading Simulator
Integrated Brokerage

Time Frame
Special Bonus!
Making Money with VisualTrader - A 2 Hour Seminar
Your VisualTrader purchase includes incredible education to help you start trading with the software immediately. Making Money with VisualTrader not only includes information-packed tutorials to help you learn how to apply VisualTrader to your trading, but also features special sections on how to use VisualTrader to trade both End-of-Day and in Real Time.
The first part of Making Money with VisualTrader focuses on the basics of the program. You will learn how to harness the power of the VisualTrader Map and Opportunity List through measurements and transforms. Armed with this knowledge, you will be ready to incorporate the Trading Strategies and Chart Patterns into your analysis and then learn how to hone your trading skills using the Playback feature.
You will also be introduced to more advanced concepts including the different types of trading setups to look for, and how to customize VisualTrader to match your trading style.
The second part of the seminar concentrates on trading approaches with VisualTrader. These concepts will give you the ability to begin trading with VisualTrader immediately, whether you trade End-of-Day or in Real Time.
Making Money with VisualTrader is presented in an easy to navigate format which allows you to watch any section of the seminar instantly. This will let you learn the program at your own pace, and view only the portions of the seminar that pertain to your trading approach. Making Money with VisualTrader (a $249 value) is included FREE with your purchase of VisualTrader!
Making Money with VisualTrader
Introduction to VisualTrader
Mastering the Features in VisualTrader
End-of-Day Trading Techniques with VisualTrader
Real Time Trading Techniques with VisualTrader
NEW Features in VisualTrader
VisualTrader Trading Secrets
Seminar Included FREE with Your Purchase