


Mobile Site Still Under Construction.
For the optimal viewing experience, please visit
this page on your
computer's browser.
Thank you!
Check back again soon.
Accurately Predicting Waves – Before
they Happen
Announcing Nirvana’s All Indicator Suite, Volume 2
Over $8,000 Worth of Nirvana’s Best
Trading Technology for Less than 1/10 the Cost!

“Wow. When I look at the Indicators we have created over the last three years for these 12 great Plug-Ins, I am amazed at how much value is in this package. Most of them are proprietary to Nirvana Systems, and all of them will help you make more money in the markets. Below are some highlights of this powerful collection. Click any Plug-In name to go to that section for more details.”
All Indicator Suite 2 is the Ultimate
Toolkit for Technical Analysis and Trading.
The All Indicator Suite 2 gives you access to EVERY indicator we have created over the past 3 years. Imagine what impact this could make in your trading?
Over the years, we created many specialized indicators for identifying trends, reversals and finding optimal exit points.
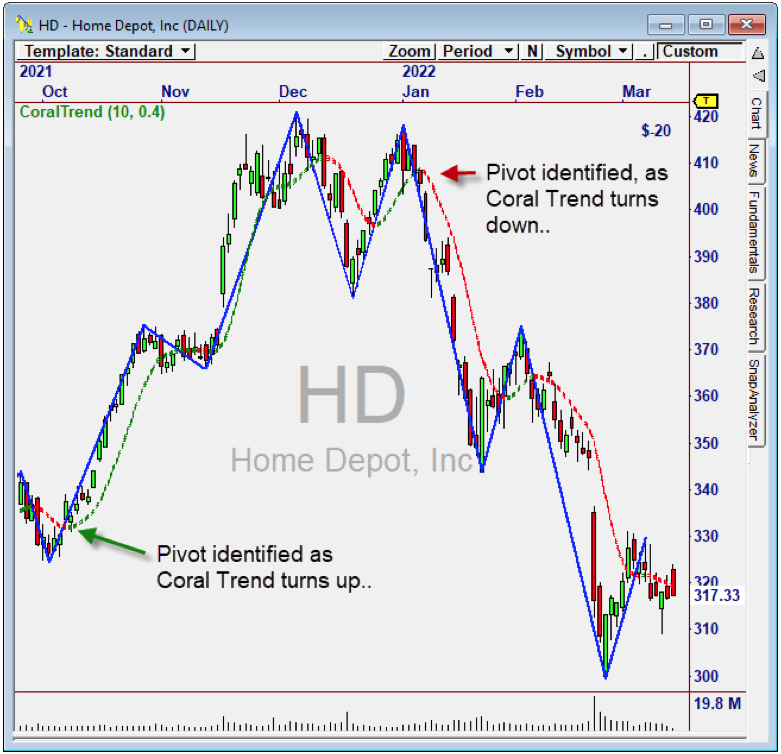
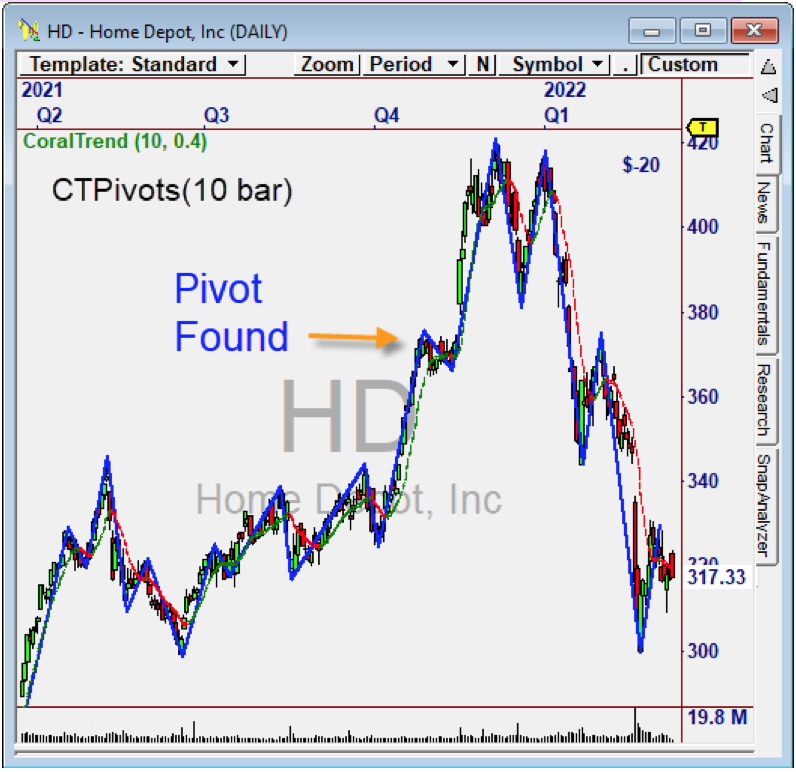
For example, Coral Trend Trader (CT Trader) - Includes CT Pivots - the fastest pivots on the planet. In this example, you can see the pivots forming just a few bars after the actual high or low - giving you the advantage.
Don't have The All Indicator Suite Vol.1? Get them both today and gain access to EVERY Indicator Nirvana Systems have created.
See special pricing for more information.

1. Catch a Wave: A unique combinations of Pivots and Volume Weighted at Price (VWAP)
makes it easy to spot moves with and against the trend.
2. CT Trader: The unique CT Pivot indicator uses Coral Trend to generate the fastest-forming
Pivots on the planet. Easily create pivot-based patterns, like the included “W/M” pattern.
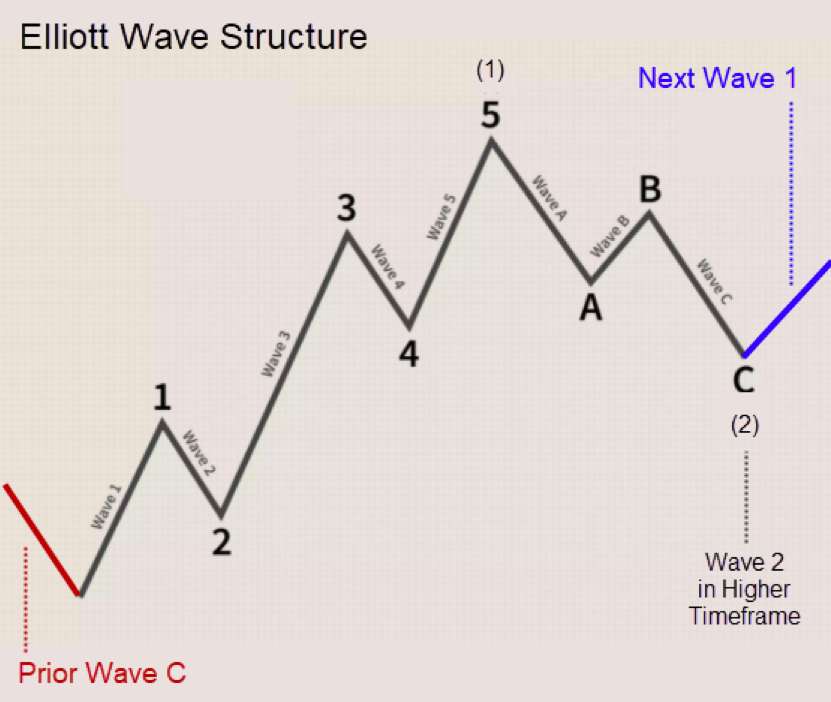
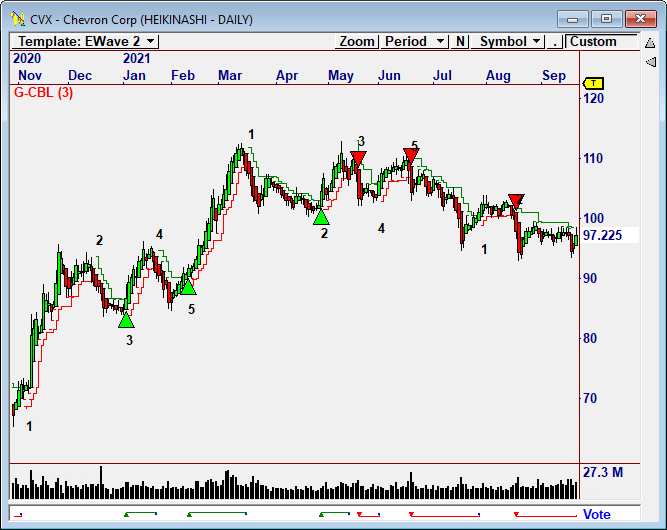
3. Elliott-Fibonacci Trader: See Elliot Wave counts right in the charts! Now you can effectively
trade Waves 3 and 5. It’s been called one of our best plug-ins by users.
4. GatorTrader: The classic “Alligator” approach by Bill Williams has been expertly adapted to our platforms with various improvements. Follow the Phases of the Gator to identify the start, middle,
and end of trends.
5. Harness Relative Strength: Unique indicators developed by Ed to identify stocks that are
taking off relative to the market. Unique Scan Indicators make them easy to find.
6. Relative Rotation Trader: Includes specialized indicators that help identify strength/weakness
of individual symbols relative to their industry sub-groups.

7. Rhino Suite: Customers LOVE the Rhino indicators because they identify high-probability moves ahead of the fact. “You can see around corners with Rhino Suite - it's that good!" - Wynn F.
8. Rocket 2: Simplified indicators provide an improved view of Relative Strength for any stock.
9. T21: Includes the famous “Gap Direction” indicator that identifies those gaps that are likely
to lead to a continued move.
10. TrendMaster: The incredible Rainbow indicator and companion oscillator make an early or
prevailing trend super easy to see in any chart.
11. VBX-4: Specialized Indicators that went into the creation of the profitable VBX-4 Mechanical
Strategy Plug-In.
12. VWAP Power Suite: Multiple indicators were developed for the VWAP Power Suite that find channel reversals and trend change. Perhaps the most powerful addition is Anchored VWAP, which is dramatically more predictive than the original VWAP.
1.
1.
"Profitable Day Trading Just Got a Whole Lot Easier!"
Catch a Wave Volume Price Indicator
CAW-VP is often seen as the best price for any given trading day. As such, any selling pressure below CAW-VP is seen as a buying opportunity, while any buying pressure above VWAP is usually seen as a selling opportunity by professional traders that are looking to either take profits or establish new short positions.


Catch a Wave Zig-Zag Indicator
The Catch a Wave Zig-Zag Indicator plots the pivots on the chart, and returns a value to determine whether the price is moving upward or downward. When the stock is moving upward the indicator returns the value -1, when the stock is moving downward the indicator returns 1. Direction shifts each time a new pivot is formed.
2.
"Identifying Today's Most Explosives Moves with Coral Trend!
Profiting from Coral Trend!
The Coral Trend indicator, is a very predictive indicator because of its ability to correctly forecast the beginning and end of moves. This powerful concept is the foundation of some of the most captivating indicators available today. The CT Pivot and Amazing W/M Pattern will change the way you see the market!
CT Pivots are Better:
CT Pivot is based on changes in the CoralTrend indicator. When CoralTrend turns up or down, the most recent High or Low is identified and drawn as the prior pivot.
Coral Trend Pivots are often found more quickly
because they are based on the turn in Coral Trend,
not a Percent or ATR move.
This makes CT Pivots ideal for any
application where pivots are used.
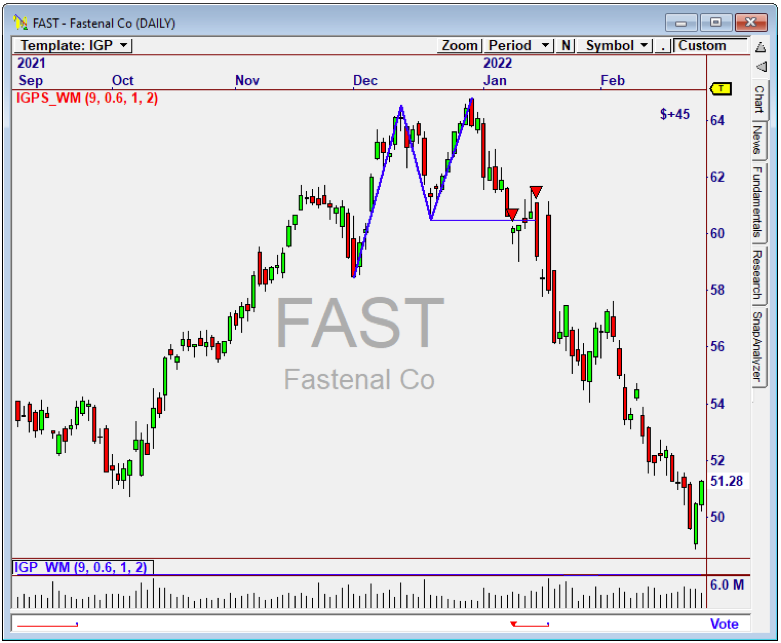
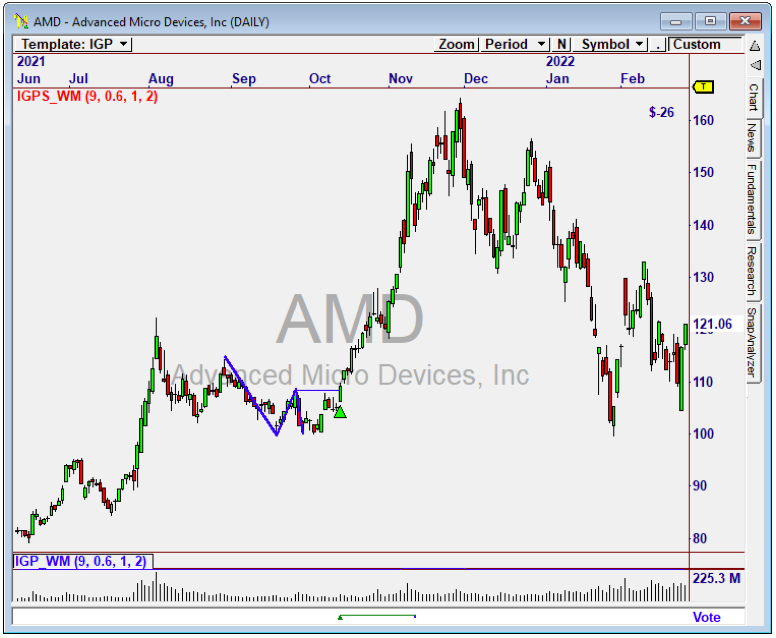
The Amazing W/M Pattern
The “W” Pattern combines a Support Level with a Breakout through the center of the pattern. When well-formed, this pattern has been proven to be effective in identifying strong moves after a long decline or rally has been observed.
In the case of a “W”, when a high is formed in between support levels to form a “W” shape, a Break of high (center of the “W”) can result in an explosive move. Similarly, the “M” Pattern often identifies falling charts after a long rally into overbought territory, as shown in the example on FAST.
3.
"You’ll Be Excited to Engage the Market
Every Day with EFT in Your Trading Tool Bag!"
Accurately Predicting Waves – Before they Happen.
Practically every article about Elliott Waves shows charts that have been marked after the fact. While such charts are great for education, and tend to show the validity of the Theory, we obviously can’t trade a historical chart.
When we set out to create EFT, we wanted to incorporate as many factors as possible to identify those Waves that have the highest probability of generating a profit. And that’s exactly what EFT does.
EFT Pivot
The secret to EFT’s power is the EFT Pivot indicator, which shows when a significant pivot has formed, based on turns in the EFT Previous Bar Level indicator. Can be used in Stops and other applications.

EFT Previous Bar Level
Previous Bar Level is a trend-following indicator that is used to generate EFT Pivots. It’s uncanny how well charts react to it, with direction changes noted as PBL is crossed.

EFT Scan
EFT includes special indicators that serve as “Scans” for use in OmniScan. Find every Wave 3 for example, or display the current Wave in the Focus List with this Indicator.

EFT Wave
Clearly see likely Elliott Wave counts right in the charts!
EFT Wave is perhaps the most visually appealing and useful of the entire set of indicators created for EFT.


GatorTrader
4.
"Nirvana's adaptation of Bill Williams'
Alligator provides special indicators that make
Trend Trading easier than ever before!"
Profit with the Power of the Alligator!
The Alligator Indicator will help you instantly understand where you are in the trend of any market. With the Alligator Indicator, when the Teeth and Jaw cross each other multiple times, the Alligator is said to be sleeping, indicating that the market is trendless. As the Lips and Teeth begin to separate, we see the beginning of an uptrend (the Alligator is waking). Finally, as price moves above the Lips the Alligator is said to be eating – a strong trend is underway!
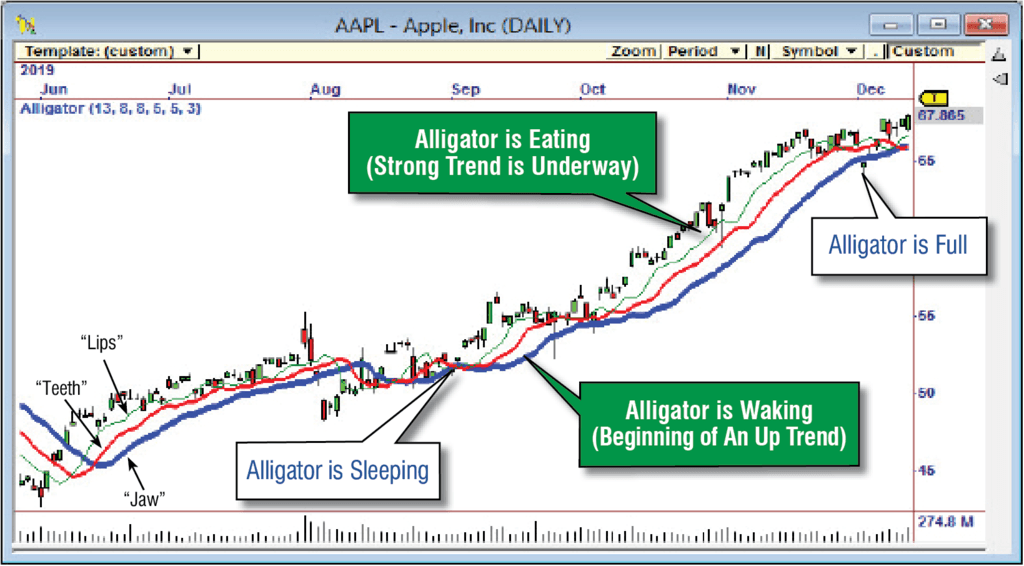
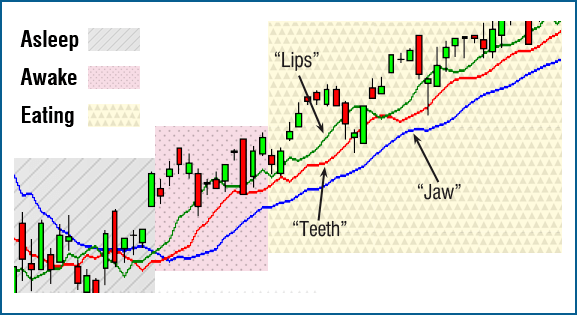
The Alligator Indicator will help you instantly understand where you
are in the trend of any market.
In the chart of Apple, two major trends occurred, one from mid-June to late July 2019, and the second from early September to late November.
With the Alligator Indicator, when the Teeth and Jaw cross each other multiple times, the Alligator is said to be sleeping, indicating that the market is trendless. As the Lips and Teeth begin to separate, we see the beginning of an uptrend (the Alligator is waking). Finally, as price moves above the Lips the Alligator is said to be eating – a strong trend is underway!

5.
"Nirvana's “Harnessing the Power of Relative Strength" is an Amazingly Simple Yet Extremely Profitable Way to Trade the Market."
Relative Strength has been used by Traders for years to determine which stocks are outpacing the market.
When combined with other key market measurements, Relative Strength forms the basis of an incredibly profitable Trading Method! All we have to do is Harness the Power!
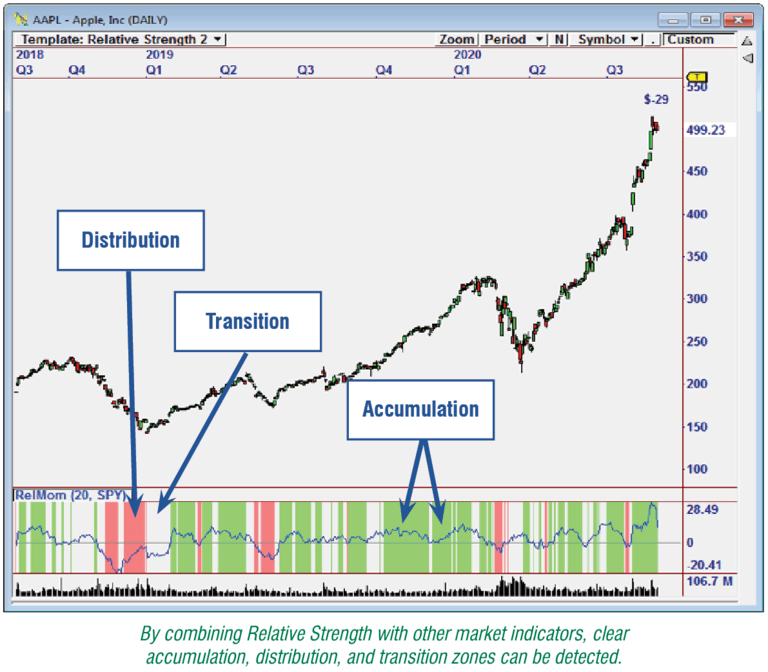
By combining Relative Strength with other market indicators, clear accumulation, distribution, and transition zones can be detected.
6.
"Industry Group Rotation is a powerful trading concept.
The indicators in RRT work together like a symphony to
help you trade the Best Group Rotation Opportunities!"
Discover the Power of Relative Rotation!
Funds and institutions often accumulate stocks based on the industry group they are in. That’s why Group Rotation is one of the best ways to trade stocks that are confirmed to be moving in a given direction. Relative Rotation Trader makes finding and trading the best Group Rotations easier than ever before, because it combines the two forces of Momentum and Relative Strength for truly unstoppable trading power!
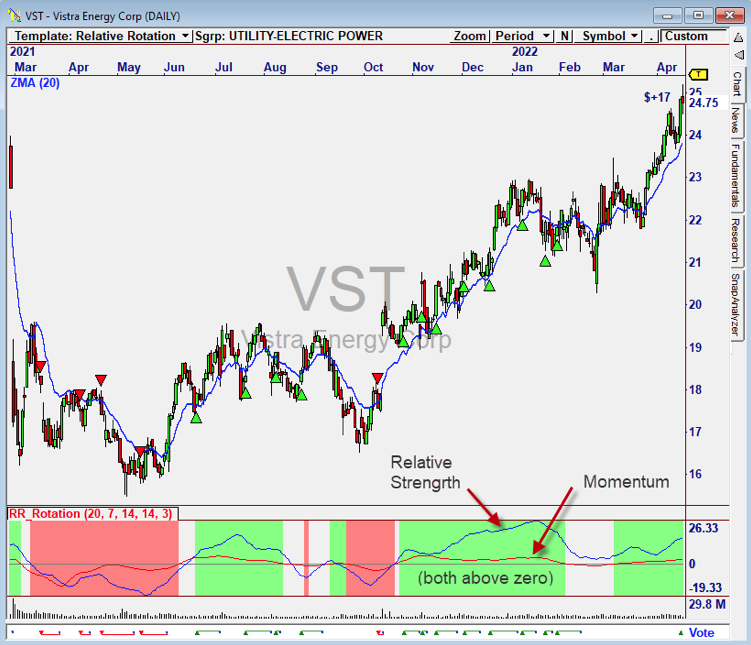
Relative Rotation indicators are about identifying the increased movement of stocks in the bullish or bearish direction (Momentum) as well as their Strength compared to a benchmark index symbol (Relative Strength).
Using these two powerful concepts, Relative Rotation Trader will help you quickly find the groups and individual stocks that are turning up (or down) in the current market.
As you can see in the chart to the right for VST, the plots of Momentum and Relative Strength combine to create a powerful indication of Strength.
When both indicators are above zero – and especially when they are rising – there is usually a lot of bullish sentiment in that market.

7.
"I'm so impressed with Rhino Suite. From a money-making
standpoint, this may be the best plugin I've ever purchased from
you. It's INCREDIBLE.!! You can see around corners with this
Rhino Suite - it's that good!" - Wynn F.
Hidden Levels Used by The Pros Revealed!
Professional traders have had an unfair advantage for years by trading hidden levels of market structure. Nirvana Systems has uncovered these tools and techniques and is providing these powerful indicators to you.
The Rhino Suite was created by Ryan Olson, Senior Market Technician at Nirvana Systems. Ryan is a 15-year veteran of advanced market analysis and has taken information provided by institutional traders and created a powerful trading package that will put you on the winning side of the market.
The Rhino Suite includes multiple indicators that reveal previously hidden
market dynamics.
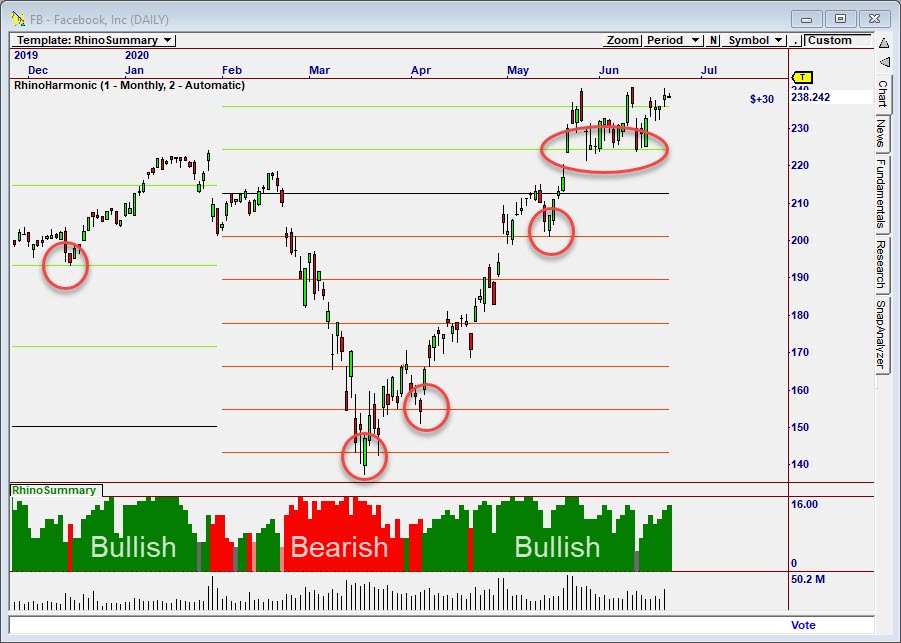
Rhino Harmonics:
Rhino Summary:
Rhino First Print:
Drafting off the power of Fibonacci Ratios, Rhino Harmonics shows you hidden levels BEFORE the rest of the market.
This remarkable indicator combines over a dozen classic indicators to show you a unique view of market momentum.
This incredibly powerful indicator provides you with accurate trading levels used by the pros.
RhinoSynapse
The RhinoSynapse Uses A Predictive Model To Identify Quick, Short-Term Trades In Any Market. Powerful In Any Timeframe, It Can Pinpoint Key Entry Swing Trade Setups (Pullbacks In Trend) To Take Advantage Of Stocks That Are Poised To Move Big And Fast.
Rhino First Print 2
We have improved the Rhino First Print to automatically adjust levels based on the Stock or ETF you are watching. This improvement gives you more accurate Market Structure levels on every stock. Long gone are the days where you needed to adjust the levels based on the stocks you were looking at.
Rhino Summary 2
One of the most exciting improvements from Rhino Suite to Rhino Suite 2.0 is the massively improved Rhino Summary. This amazing tool transformed from powerful to inspirational. Fully redesigned Rhino Summary 2 provides instant information on over 19 different indicators. Showing you an instant consensus on market sentiment. Now you can also see exactly the make up of how many longs and shorts are participating in every market condition.
8.
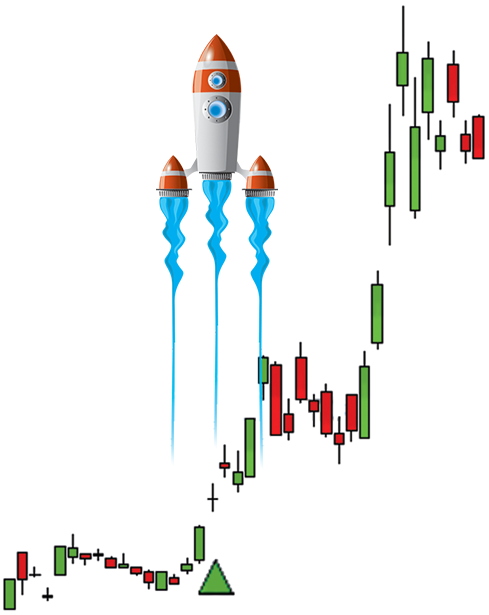
"Rockets" are stocks that are "taking off" to new heights!
Rocket 2 simplifies the Rocket Trading approach with new
indicators that can quickly find these profitable trades."
The Essence of the RocketTrade Method
I researched two key concepts that led me to create the Relative Strength indicators used in the Method.
The first indicator measures the difference between the current Relative Strength and prior values of Relative Strength, and is thus called the “Difference” indicator.
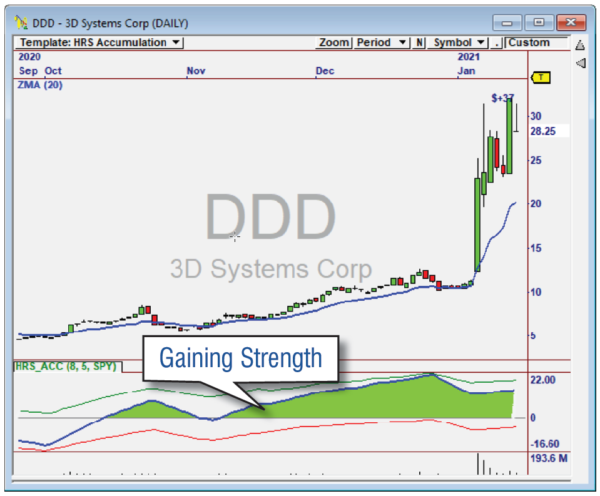
In DDD, we see the Accumulation indicator trending up above zero since early November – an indication the stock would continue up.
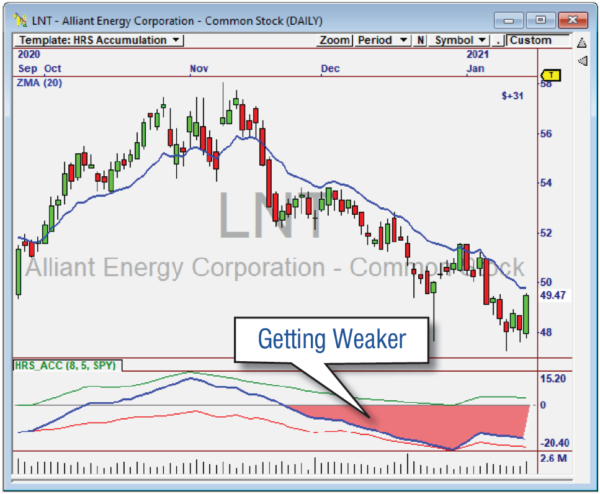
The Accumulation Indicator goes negative for LNT in late November, showing weakness that continued from there.
T21
9.
"The Gap Direction Indicator Helps You Avoid Taking Trades
in Markets That Are Volatile in the Overnight Session!"
The T21 Breakthrough!
This project is unlike anything we have undertaken before. Our objective was to create Universal Trade Plans that can be used to improve existing Strategies, and then to apply them for that purpose.
To do this we created a set of indicators to be used as filters and inputs. The results were incredible and now this powerful indicator can be yours!

10.
"Based on a Unique Recursively Smoothed
Moving Average, the Rainbow Indicator Gives You
Exceptional Trend Direction and Strength Information!"
The Rainbow Oscillator – Powerful Signals from the Rainbow Indicator
The Rainbow Oscillator uses the same information as the Rainbow Indicator, but with additional calculations to show potential changes in trend. The oscillator can be used to produce buy and sell signals, as well as determine overbought and oversold levels.
As the Oscillator grows in width, the current trend is increasing its intensity. However, if the value of the oscillator goes beyond 80, the market becomes more and more unstable, meaning we need to watch for a sudden reversal. When the oscillator becomes more and more flat, the market tends to remain more stable and the bands narrow to confirm this.
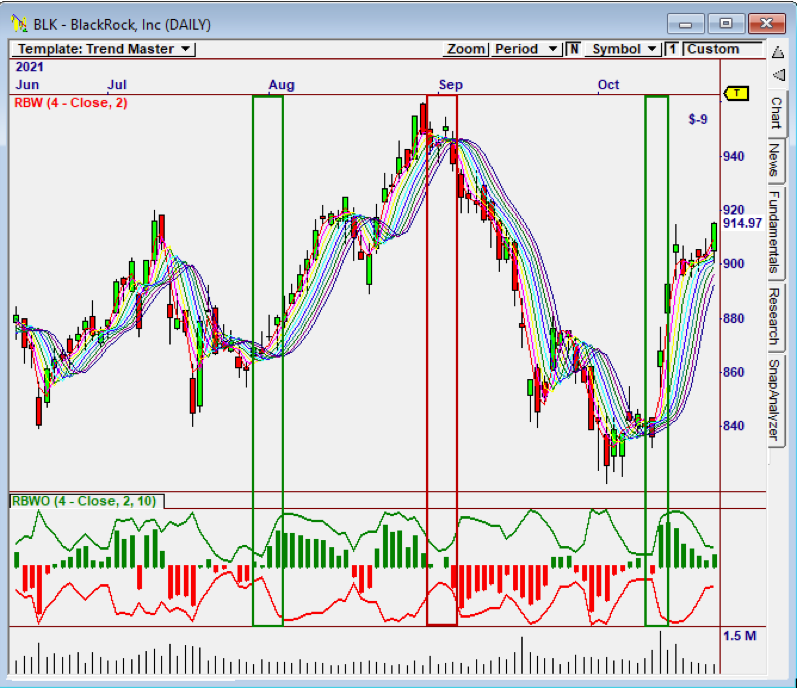
BLK shows where the Indicator tightened and expanded at reversals.
11.
"The Powerhouse Behind Our Most Profitable Strategy Ever
is Now Available for All Indicator Suite Vol. 2 Customers."
All Indicator Suite Vol. 2 is The Perfect Time and Way to Get on Board!
Our objective in launching into the VBX-4 project was to create a MECHANICAL Strategy with high enough performance to deploy on a live account.
The good news is VBX-4 has truly impressive mechanical trading results.
Now, with the All Indicator Suite Vol. 2 you have access to one of the most accurate gap indicators available used in this highly accurate VBX-4 Strategies.

12.
"The Most Powerful Tool for Traders
Just Got a Whole Lot Better."
Experience VWAP Like You Never Have Before!
Known as one of the most potent trading tools used by the most successful traders and institutions VWAP has been the premier way to find value in stocks, commodities and crypto for years.
Nirvana Systems, Inc. has built upon this incredible tool to create the VWAP Power Suite. The All Indicator Suite 2 Includes the incredibly intuitive Anchored VWAP and Moving Average VWAP.
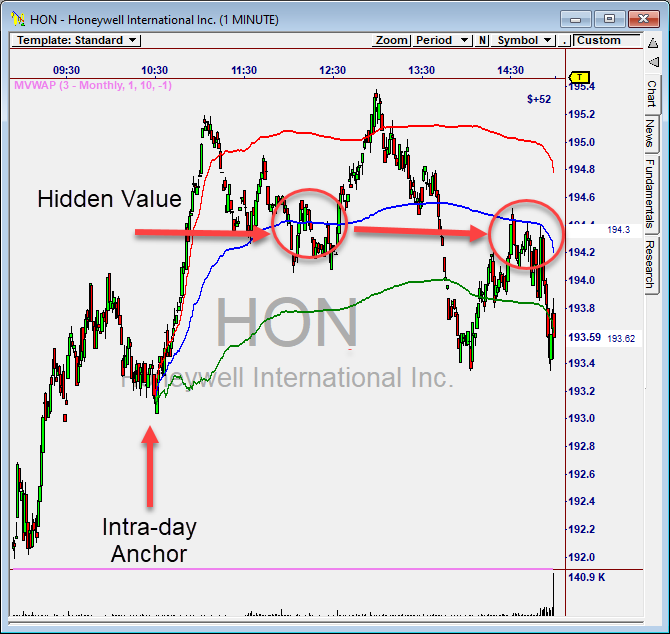
VWAP has been one of the most potent trading tools used by the most successful traders and institutions for years. VWAP has been known to eliminate the noise that occurs during the trading day. But as you know the later in the day you get – the less effective VWAP is. This is where Anchored VWAP comes to help.
Anchored VWAP allows you to quickly find key events in a chart and plot a new intra bar VWAP that provides you with an amazingly clear view of REAL TIME price action.
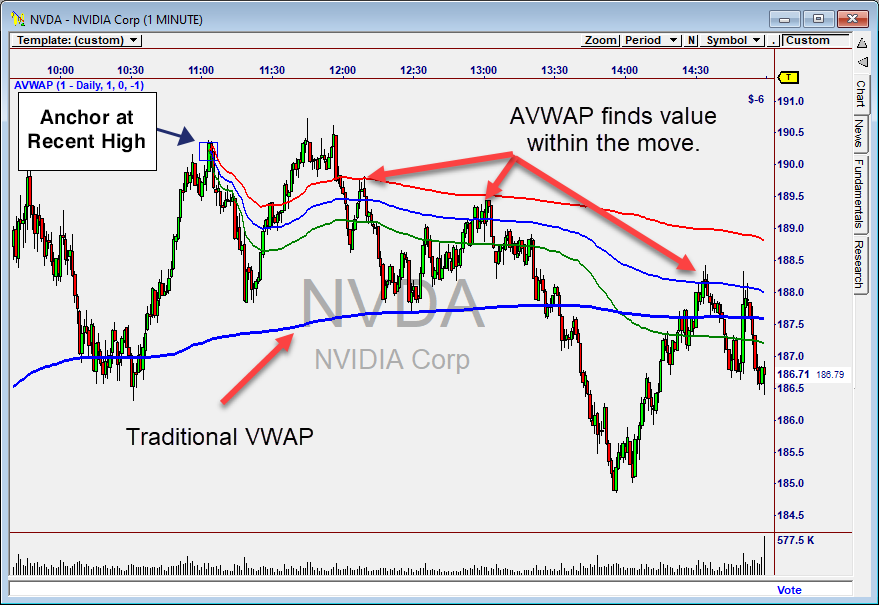
This is important to traders because key support and resistance levels are constantly changing and what held true at 9 am almost never holds true at 2 pm. With Nirvana’s VWAP Power Suite you’re in control of the future.
Look at all the Powerful Indicators Included in AIS2!
CAW
CAW_VP
Catch A Wave Volume Price
CAW_ZZ
Catch A Wave Zig Zag
GatorTrader
AlligatorJaw
Alligator
AlligatorLips
Alligator
AlligatorTeeth
Alligator
GatorLow
Gator Oscillator
GatorUpper
Gator Oscillator
GatorEating
GatorEating
GTAcc
GT Acceleration Oscillator
GTAweOsc
GT Awesome Oscillator
Trend Master
RBW (Upper/Lower)
Rainbow
RBWO (RBWOSC)
Rainbow Oscillator
T21
Gap_DIR
Gap Direction
T21_ZZ
T21 Zig Zag
CT Trader
CTPivot
CT Pivot
CTWM
CT WM
HRS
HRS_ACC
HRS Accumulation
HRS_DIFF
HRS Difference
HRS_MKT
HRS Market
HRS_PBL
HRS Previous Bar Level
Relative Rotation
RR_Diff
RR Difference
RR_Direction
RR Direction
RR_Momentum
RR Momentum
RR_Rotation
RR Rotation
RR_Strength
RR Strength
Rocket 2
RKT_Acc
RKT_Acc
RKT_Diff
RKT_Diff
VBX4
VBX4_Gap_DIR
VBX4 Gap Direction
EFT
EFT_Pivot (High, Low)
EFT Pivot
EFT_PBLEFT
Previous Bar Level
EFT_Scan
EFT Scan
EFT_Wave
EFT Wave
Rhino
RhinoBands
Rhino Bands
RhinoBands_Trigger
Rhino Bands
RhinoFP
Rhino First Print
RhinoFP2
Rhino First Print 2
RhinoHarmonic
Rhino Harmonic
RhinoHullMA
Rhino HullMA
RhinoRelVolume
Rhino RelVolume
RhinoSummary
Rhino Summary
RhinoSummary 2
Rhino Summary 2
RhinoSynapse
Rhino Synapse
RhinoSynapseFilter
Rhino Synapse
VWAP
AVWAP
AVWAP
AVWAP Bands
AVWAP Bands
MVWAP
MVWAP
Some of the most important
advancements in trading tech
...and now you can gain access to aLL of the
powerful indicators at an unprecedented value!
Plug-In Prices
Harness Relative Strength................
GatorTrader.............................................
Catch A Wave.........................................
T21..............................................................
RhinoSuite...............................................
RhinoSuite 2............................................
VBX-4........................................................
Elliott-Fibonacci....................................
TrendMaster...........................................
RocketTrader 2......................................
CT Trader..................................................
Relative Rotation..................................
VWAP Power Suite..............................
$295
$495
$995
$295
$495
$595
$995
$995
$495
$995
$495
$695
$595

These indicators would normally cost over $8,000
...if purchased individually.
* AIS2 includes all indicators from each Plug-in - Plus documentation on hot to use them. Strategies, etc. are not included.
Volume 2:
$695
Reg. $995

Add on Volume 1 for only $300!
Volumes 1 & 2:
$995
Reg. $2,400
Nirvana Club Discounts Apply
The Predictive Elliott Wave System
Probable Elliott Waves marked
as they occur – not in hindsight.
For nearly 90 years, Elliott Wave Theory has been used to measure market psychology and predict future moves. When combined with Fibonacci Retracements, its predictive power is even stronger. Elliott-Fibonacci Trader (EFT) combines these two approaches to produce one of the most profitable tools available to traders anywhere. What are Elliott Waves?
Our software is backed by our unconditional Money Back Guarantee. If for any reason you are not fully satisfied, you may return the software, within 30 days of purchase, for a 100% refund, less shipping and handling. Texas residents add 8.25% sales tax. Educational material is non-refundable.
Important Information: Futures, options and securities trading has risk of loss and may not be suitable for all persons. No Strategy can guarantee profits or freedom from loss. Past results are not necessarily indicative of future results. These results are based on simulated or hypothetical performance results that have certain inherent limitations. Unlike an actual performance record, simulated results do not represent actual trading. There are numerous market factors, including liquidity, which cannot be fully accounted for in the preparation of hypothetical performance results all of which can adversely affect actual trading results. No representation is being made that any account will or is likely to achieve profits or losses similar to these being shown.