Volume Systems 2.0
$395
Compatible Platform: OmniTrader / VisualTrader
Recommended Data: End Of Day / Real Time
Volume Analysis generates Faster Signals. Faster Signals mean Bigger Profits!
Turn up the Volume and HEAT UP YOUR PROFITS!
Beat the Pros at their own game!
With the Volume Heat Indicator, you can see the Professionals entering and exiting the market...and that’s information you can profit from.
Volume is the lifeblood of any market. We know that it is the imbalance in supply and demand that makes a market move. And closely related to this is the concept of liquidity—how rapidly a market will absorb our shares when we decide to sell them.
A quick look at any chart will tell you that trading volume is not uniform, but rather comes in waves or spikes. We know that on
large volume days, sudden buying or selling has entered the market for a reason, and depending on supply and demand for the shares, price will either continue a prior trend or form a reversal.
Volume Flow analysis is the study of price movement in the context of these unusual volume events. In Volume Systems 2.0, we built several indicators designed to show us how much movement potential exists in a chart at the point one of these events occurs.
Volume Heat, shown on this page is a fabulous visual tool for quickly SEEING the events, because you can’t miss the change from red to green. Using Volume Heat as our base technology, we developed our Volume Flow Oscillator and additionalVolume Weighted Indicators, Systems, and Strategies that are showing phenomenal performance.
The Volume Systems 2.0 Power Strategy uses both the DVF-C and VWMACD-C Systems. It combines them to look for tell-tale signs that the professionals are beginning to accumulate a stock. And we must admit, the concept is simply amazing. In a recent test on the Russell 1000, we generated the following statistics on the 100% Mechanical Strategy:
Period ..................... 1/09 – 6/10
Trades .................... 455
Hit Rate .................. 72%
Average Bars ........ 38
Average PPT ......... 11.8%


This is an incredible average profit per trade for a Mechanical Strategy. And it’s showing 72% accuracy.
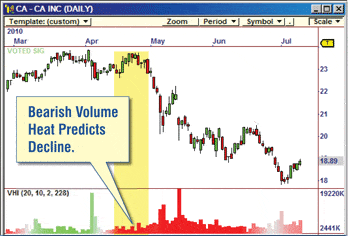


Volume Heat in action. By examining past price and volume behavior, the indicator can predict changes in trend, as shown here.
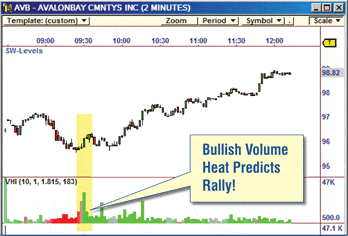


Volume Heat makes it easy to see changes in trend. The other Indicators and Systems in Volume Systems 2.0 are based on this.
Included with Volume Systems 2.0
Volume Indicators
- Volume Heat Indicator
- Volume Flow Indicator
- Volume Weighted MA
- Volume Weighted MACD
Volume Systems
- Dual Volume Flow Crossover
- VW MACD Crossover
- Volume Flow Divergence
- VW MACD Divergence
Volume Strategies
- Volume Power Strategy


