Overview
ARM2 R3 was developed using a Neural Network, and is capable of signal accuracies of 65% - 70%
History of ARM2
ARM2 Release 2 was our first version of ARM Technology delivered to Club members, and was based on a Genetic Algorithm process home brewed here at Nirvana. ARM2 R2 was tunable by the user in terms of desired signal accuracy vs. signal count - a major advancement.
ARM2 Release 3 used a Neural Network to determine a positive or negative score at any bar in a chart. The network in ARM2 R3 determines a "likely up" or "likely down" state for the chart at any bar. This gave us a new capability, since ARM2 R3 can be applied to ANY trading signal. ARM2 R3 was released in 2000.
In 2002 and 2003, we began experimenting with pattern recognition concepts. ARM2 R4 is based on these findings, which are an application of J.M. Hurst's work on Valid Trend Lines. The proprietary Nirvana Club VTL-B System is still being used to improve performance in ARM3.
ARM3 - The Next Generation
The version of ARM Technology, called ARM3, was literally 'heads and shoulders' above the prior versions. Using recent advances in Artificial Intelligence and taking advantage of the faster processors available today, we re-built our Neural Network and Genetic Algorithm components from the ground up.
Members can now build their own Knowledge Bases quickly and easily by simply training our Networks or GAs on their own symbol lists. Or, they can create their own networks using knowledge they have about Technical Analysis. And, in 2006, we improved the Genetic Algorithm component further.
ARM2 Release 4 uses a new pattern recognition concept called Valid Trend Lines, producing sharp trades at key reversals. Accuracies produced are typically in the 70% to 75% range.
ARM3 is an improved version of our original ARM2 technology. This chart shows the Neural Network in action on Microsoft.
The Move to Equity Curves
Before 2007, we had been using a signal measurement technique called Next Pivot Points, to measure Signal Accuracy. This method told us whether the Entry Signals on a Strategy were improved, but did not yield strategies which could be "mechanically" traded because there were no actual Exits.
All that changed in 2006. Our Artificial Intelligence technology is now powerful enough to apply real exits to our strategies - producing Strategies that can be traded mechanically.
Our focus now is on improving performance in the Equity Curves until we have reached our Ultimate Trading Machine goal. However, since we are delivering Strategies to Members that show mechanical profitability over long periods of time, many members are engaging the market with these products
NSP-33 NN
In 2008, we launched a new mechanical strategy called NSP-33. This strategy showed the ability to generate an average return of 20% per year from 1998 through July 2009. Bull Market or Bear Market – this amazing strategy has consistently pumped out profits year after year. After the Strategy was delivered to the Nirvana Club, we applied our ARM3 Neural Network to it to create NSP-33 NN. The result was another immediate performance improvement. By August 2009, NSP-33 NN was up an incredible 38%.
ARM4
A Breakthrough in Artificial Intelligence for Traders
In 2009, we pushed the envelope ahead again, with the new Consensus Block. This new A.I. tool makes it possible to measure the predictive power of any list of formulas or indicators. This is very important, because we are able to eliminate the ones that don’t work well and focus on those that do. When we began this research, we were hoping to build a tool to assist us in this task. What we ended up with was so powerful, we increased our ARM technology to ARM4.
The first Strategy to be developed with ARM4 is NSP-35 CB (Consensus Block). It is based on a careful selection of indicator formulas that identify the best trading situations. The Consensus Block identifies those ranges that are most predictive, and then it combines them into a “consensus vote”. The power of this approach is evident in the NSP-35 CB Equity Curve, showing over 30% annual profit from 2001 through 2009.
Improving Strategies with ARM4
In 2010, we added Data Mining to our Neural Network process, which dramatically improved performance. In some cases we are seeing the profits DOUBLE in our best Strategies!
We are using our ARM technology to empower traders to achieve a superior return. As we do this, we will continue to build new Strategies with tor ARM technology. With the performance gains we are currently seeing, this could easily be the year that we hit our Ultimate Trading Machine goals.
In this chart, you can see multiple ARM2 signals firing in the direction of trend.
About ARM2 R3
ARM2 was designed around the concept of relating Market Factors (such as the current retracement percentage for a move) with Clues (e.g., volume increasing) to predict the accuracy of a given Signal using Artificial Intelligence methods.
After launching the Nirvana Club in 1996, we built a Genetic Algorithm to find combinations of Factors and Clues that formed "rules" in a Knowledge Base, such as "If MACD is rising and Volume is increasing and today's Open is above yesterday's Close, there is a 70% chance of the security going up."
This process involved many thousands of processing hours. We networked all our machines together and let them "cook" each night to find these rules.
In 1998 we released the first Knowledge Bases to members, calling it ARM2 Release 2 (Release 1 was experimental). ARM2 R2 improved accuracy by about 10 points. That was a great start, but we had a way to go. So we continued looking for better ways to do the same job.
ARM2 worked extremely well on stocks that exhibit smooth changes in trend.
Note: ARM2 is no longer used by members (since ARM3 is more accurate), but we have preserved it on our Nirvana Club web site for members to download and experiment with, at their option.
ARM2 R3 - Our First Neural Network
In 1999 we released ARM2 R3 using a commercial Neural Network. We discovered that Neural Networks are better suited to our problem (though we later re-invented the Genetic Algorithm component when we created ARM3.) Market Factors and Clues were fed as "inputs" into a the Nerual Network to find relationships in the data.
At each Signal event, a Neural Network was consulted to determine the likelihood of the security rising or falling based on the trained Neural Network. The Network issued a "Thumbs Up" or "Thumbs Down" indication on each Signal. Signals were then either passed to the Vote Line or not based on this determination.
The ARM2 Release 3 Neural Networks increased the accuracy of OmniTrader's buy/sell signals by 10 to 20%. An OmniTrader profile that generated an average Forward Test accuracy of 55% could generate accuracies on the order of 65 to 70 percent. This was a phenomenal achievement so early in the Club's life.
How is ARM2 Different?
An important aspect of all ARM2 (and ARM3) strategies is the fact that optimization is not used. Standard OmniTrader profiles (like Default) work by optimizing every Symbol individually to find the best parameters for the Systems being used. This is a good way to tune a System, but has the disadvantage that as soon as a new Back Test is run, the Signals will change as new parameters are chosen.
With ARM2 and ARM3, System Parameters are fixed and do not vary, which in turn means the signals will not change. Signals that are passed to the Neural Network either "make it" to the Vote Line or filtered out the same way regardless of how when the Back Test is run. The same Signal will always be seen in the Chart. This behavior definitely makes it easier to "trust" the Signals in real trading.
The Next Generation ARM2
This was very important in our understanding of how to apply Artificial Intelligence technology to the market problem. Using this knowledge, we developed the next generation of A.I. tools for members that takes advantage of OmniTraders' Strategy Builder paradigm - ARM3. ARM3 is our current Nirvana Club Signal Technology.
What is ARM3?
We have seen many technological advances since ARM2 was created in 1996-98. Computers dramatically increased in both speed and memory. With the introduction of Trade Plans in OmniTrader 2004, we were able to create strategies from building blocks. We rewrote our A.I. engine, creating components which are collectively called "ARM3."
Two Powerful New Technologies Make it Happen.
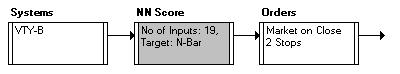
NN Score
The new NN Score component uses a Neural Network to score signals from any system or vote combination, essentially replacing the Advisor Rating. The PRIMARY input to the NN Score component is a Signal Line within an OmniTrader Strategy - that is, a line populated with trading signals. The SECONDARY inputs, which are used for training, can be any trading system(s) and any indicator or difference between indicator or price values, such as Close(Today) - Close(Yesterday).
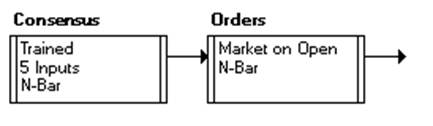
The component takes the inputs at points the given Signals occur, and creates a Neural Network to optimize a given target, such as "Profit 5 bars in the future." A Score is generated based on "fitness" of the inputs to the given target. Within the component, the Score can be set to a threshold, so that only the best signals are sent on to the next step in the Strategy (typically Orders, as shown above).
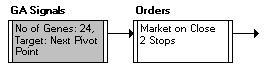
GA Signals
GA Signals is similar to NN Score, in that it uses internal inputs defined from technical measurements and trading systems. However, GA Signals does not score an existing signal line - it CREATES signals from the inputs. GA Signals is useful in situations where you are not sure which system to use to generate a signal, but have an idea that several systems and measurements, when combined, could create a good entry.
That is, by combining 3 Systems and 3 Indicators (for example), some combination thereof would generate a signal - you just don't know what that combination is. GA Signals iterates on the problem space using a Genetic Algorithm process, until it has converged on numerous "rules" which are then added to a Knowledge Base, such as "Long Signal when MAC-M fires a signal and Volatility is between 2.5 and 3.5 and Close is more than 5% above the 21 period Moving Average."
Advantages of the new technology:
- Much higher accuracy and profitability. We are seeing Networks and Knowledge Bases with over 80% accuracy and high profit-per-trade numbers. We have also generated several mechanical strategies which use mechanical exits, creating 100% mechanical systems.
- Improve the Scores and Performance of any existing system. If you have a system you really like in OmniTrader, the NN Score component is likely to make it better. By using the "canned" settings in the component, you can turn it loose in a strategy on virtually any system and get higher Hit Rates and APRs from the same system.
- Users can Train or Retrain Networks and Knowledge Bases. If you have a list of stocks or futures you would like to "tune" ARM3 to, just activate the ToDo List and specify "ReTrain" in a profile that has ARM3 Strategies. The Knowledge Bases or Networks will be retrained on YOUR data.
- Members can experiment with their own theories. It takes minutes to define the measurements and inputs for a Neural Network or Genetic Algorithm Knowledge Base inside the NN Score or GA Signals components. If you have an idea about a combination of systems and measurements (indicators) that you believe would predict the market well together, set up an experiment, build a Knowledge Base and test it out. You have the power.
ARM3 is based on the concept of measuring technical inputs and feeding them into a Neural Network to find profitable relationships. This process has yielded some of our best strategies, including NSP-33 NN. However, one of the challenges in building these strategies has always been, “How do we identify the best inputs to use?” This year, we set about answering this question.
The Consensus Block represents a major advancement in technical analysis. It’s the perfect marriage of artificial and human intelligence, providing detailed insight into how different indicators and events help to predict future market behavior.
The Consensus Block performs two separate jobs, the first of which is called “Data Mining.” For this step, we define a list of indicators and formulas that we think might be predictive. Then we enter them in the Consensus Block and let it measure them across a large symbol list and years of data.
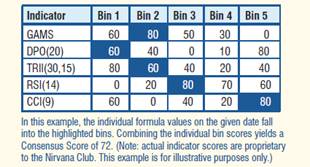
The result is a table that indicates the predictability of each input (see example) for different ranges of the input. In the second step, the Consensus Block combines the given inputs using a Genetic Algorithm, resulting in a score from 0 to 100. We only trade those signals with the highest scores.
With the Consensus Block, we can now greatly accelerate our development of profitable trading strategies. The fi rst is NSP-35 CB (discussed next).
The "Rocket Science" (How it Works)
The following example demonstrates how the various features of the Consensus block can be used to gain knowledge into predictive measurements and create a trading strategy. As previously discussed, several configurations are possible. In order to prove the concept, we will employ the simplest configuration that consists in a strategy with only two blocks.
Step 1: Data Mining
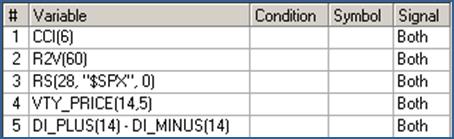
First, we select a comprehensive number of measurements that - we think - may characterize the behavior of the symbols in our list. For the present example, we are using the SP100 in the daily timeframe. The following dialog box shows some of the variables that were selected. Note how some measurement formulas are repeated with different parameter values, usually the Period parameter in order to see whether a slower or a faster indicator is more predictive. For sake of simplicity, no conditions were specified in this example.
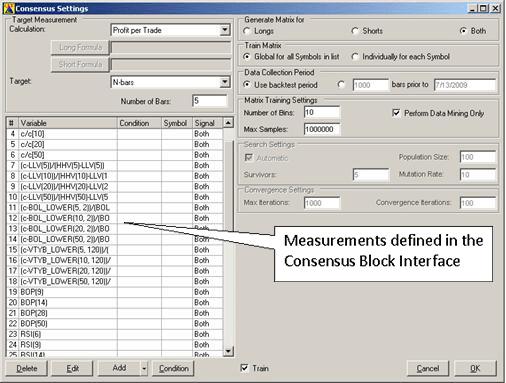
A total of 51 variables were specified in this Consensus block. In order to reduce the number of variables to a smaller set of effective measurements, we will start by performing a Data Mining run (with Perform Data Mining Only checked in the dialog box). In addition, because we intend to collect data at every bar for several years (from 2001 to 2006) and over about 100 symbols, we increase the Max Samples setting to 1,000,000, thus ensuring that all collected data samples are represented in the statistical results. The Data Mining run can now be initiated. For a large experiment such as the one described, this run can take several hours, depending on the computer system's specifications.
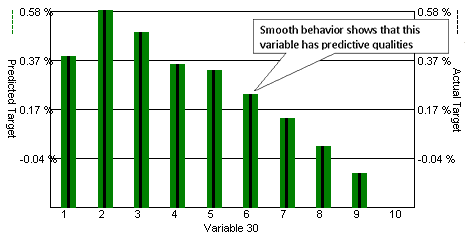
When the run is completed, we access the Data Mining and Matrix Analysis interface in order to identify the measurements that showed a significant correlation with the recorded target. The next figure, taken from the Consensus Block Analysis screen, depicts the relationship between CCI(9) and the average target value. With the exception of Bin(1), a well-defined decreasing function is clearly visible. After reviewing quartile and standard deviation measurements in the statistics table, we can safely say that – for this particular setup – CCI(9) has predictive value.
Target Sensitivity plot for CCI(9).
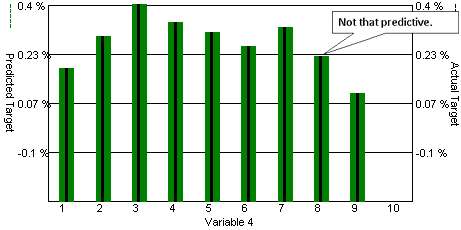
However, the next view shows Close / Close ten bars ago (C / C[10]) without significant correlation. This variable can be deleted from the strategy to simplify the configuration in preparation for a full training session.
Target Sensitivity plot for C / C[10]
After repeating this analysis for all variables, we selected the smallest number that exhibit the best correlation with the targets:
Step 2: Evaluating the Results
After we identify the indicators and other formulas we want to use for trading, we train again on ONLY those values, allowing the Consensus Block to combine individual values to produce a Consensus Score after it finishes its Data Mining Step. Consensus Scores vary from 60 to 100.
By increasing the Consensus Cutoff and running profitability tests on the resulting signals, we see a DEFINITE RELATIONSHIP between CONSENSUS SCORES and PROFITS.
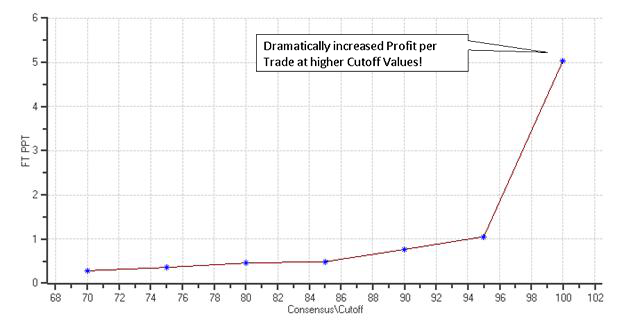
The following diagrams depict the number of trades and average profit per trade results obtained by varying the Consensus Cutoff (Filter) value, the back-test is the same period used for data mining runs, while the forward-test is the remaining data up to July 7th, 2009. You can see from the graph that the profit per trade increases while the number of trades decreases at higher cutoff values, confirming that the chosen variables can indeed produce valuable predictions for the 5-bar price movement.
Forward-test Profit per Trade vs Consensus Cutoff
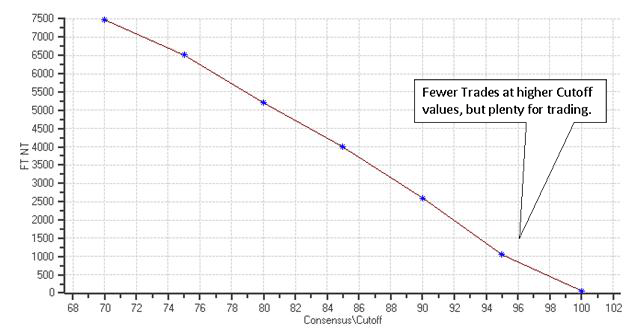
This plot not only proves that the Consensus Block “works” – it shows greatly increased profits at high Cutoff Values. The next plot shows the expected relationship between Cutoff Values and Trade Count – the higher the Cutoff, the fewer trades “pass” to the Vote Line. But, the great thing about the Consensus Block is, even at high Cutoff levels (like 96) there are still a very large number of trades.
Number of Trades in the Forward Test vs. Consensus Cutoff Value
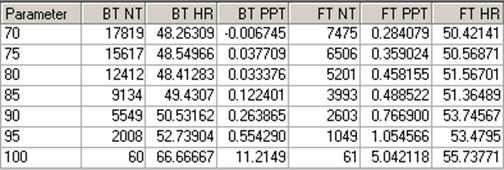
Full Statistics for different Consensus Cutoff values.
Step 3: Trading with the Results
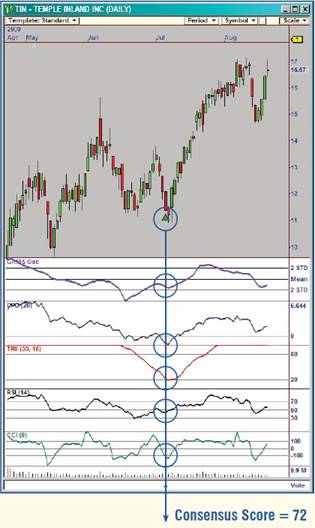
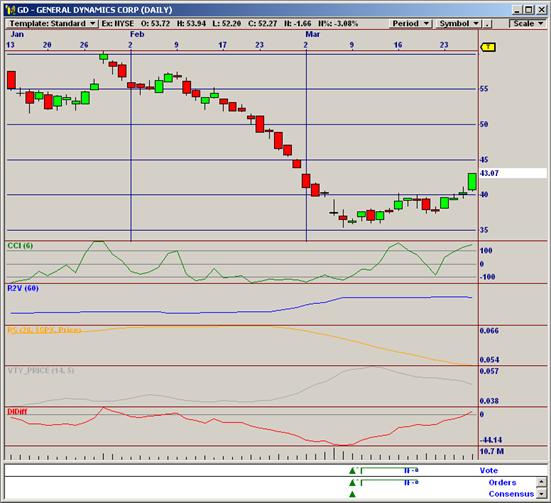
The next screenshot shows how the consensus block in this strategy was able to identify the bottom of General Dynamics Corp on 3/9/2009 (in the forward-test period) by combining the predictions obtained by each of the indicators displayed in the chart. Trades like this are common in the output of the new NSP-35 CB Strategy, to be released to the Nirvana Club in the Fall of 2009.
A Consensus Block trade on General Dynamics Corp. The chart
including plots for the indicators used by the Consensus Block.
In 2010, we added Data Mining to our Neural Network process, which dramatically improved performance. In some cases we are seeing the profits DOUBLE in our best Strategies!
Millions have been invested in the development of ARM4, which is by far the most powerful Artificial Intelligence technology ever created for traders. As a result of recent advances, we are now seeing 80% Hit Rates in many of our Strategies— the first performance goal for The Ultimate Trading Machine.