


SnapAnalyzer
$199
Compatible Platform: OmniTrader / VisualTrader
Recommended Data: End Of Day / Real Time
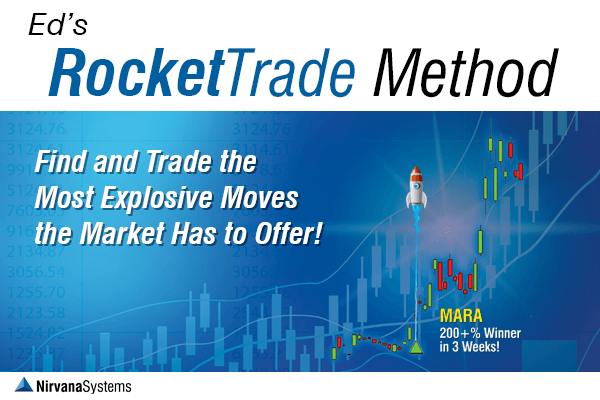
All markets provide opportunities like those shown in the charts above – overextended points that invite buyers to enter the market at a temporary reduction in price.
Its graphical dashboard shows you which trades have the greatest “Snap” potential by identifying the key characteristics of the best snapback trades: sharp pullbacks within a strong trending market.
Find the Most Explosive Moves with the NEW SnapAnalyzer!
All markets provide opportunities like those shown in the charts above – overextended points that invite buyers to enter the market at a temporary reduction in price.
We have many Strategies that find these kinds of trades, like T3, VBX-3, Swing-13, and RTM7 to name a few. But what we HAVEN’T had up to now is a way to rank, sort and evaluate these opportunities in addition to the Buy or Sell Signal.
Now, you can add a Snap column to your Focus List and instantly identify the symbols with the greatest Snap potential. Just sort the list to find the best candidates, open the chart, and review the SnapAnalyzer display (see next page for example).
Even if you don’t own any of these Plug-In Strategies, you can use the Snap Potential Indicator to quickly go through any Focus List and find those symbols that have the highest Snap Potential. Trading these candidates End of Day with Market on Open orders can be very profitable.
Finding "Spring-Loaded" Trades
The secret to finding explosive moves is to find sharp pullbacks within strong-trending markets. In other words, you want to find conditions where the market is “spring loaded” in your favor. That’s what SnapAnalyzer does.
Measuring Pullbacks
The SnapAnalyzer uses proprietary measurements to gauge the Snap Potential of any chart. This measurement shows how stretched the chart is, which has a strong correlation with the likelihood and size of the snapback.
The SnapAnalyzer also uses an internal automatic testing feature that helps you see how well this particular stock has reacted to similar snapback setups in the historical data.
Measuring Strength
The second component to a good snap trade is the underlying long term strength of the stock. Our three strength measurements give you the whole story on the current symbol. The Long Term Strength shows you the current trend/bias for the symbol you are viewing.
Similarly, Group Strength and Market Strength help you further confirm the trades. When the market is strong you have a rising tide, yielding higher probabilities for success. Similarly, the Group Strength measurement helps you identify when this type of setup is occurring.

The Tradeability Measurement
Another key factor is the “tradeability” of the underlying chart. A stock making a big move does a trader no good, if the trader can’t actually manage the trade. The Tradeability measurement helps identify stocks which move in an orderly fashion from lows to highs. This helps avoid overly volatile symbols so you can focus on charts which have the inherent “smoothness” characteristic all professional traders look for.
