


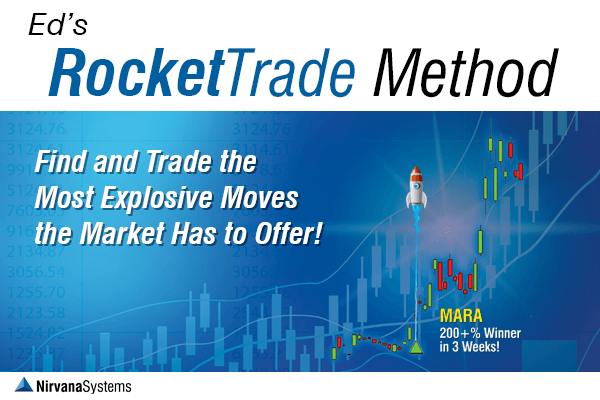


Harness the Power
of Relative Strength!

“The Most Profitable Method I Have Ever Traded.”
Greetings! This past Summer and Fall, I worked on a concept that most of us are familiar with called Relative Strength. Relative Strength (RS) is about measuring a stock’s value relative to an index or other base market. (Note: Wilder’s Relative Strength Index, or RSI, measures Relative Strength within a symbol, not to the market).
Relative Strength can show which stocks are currently beating or lagging the market. But what I found is that it’s not powerful enough by itself. High values of Relative Strength can easily yield over bought candidates that have made their move. It needs to be taken to a new level to yield a consistently profitable trading tool.

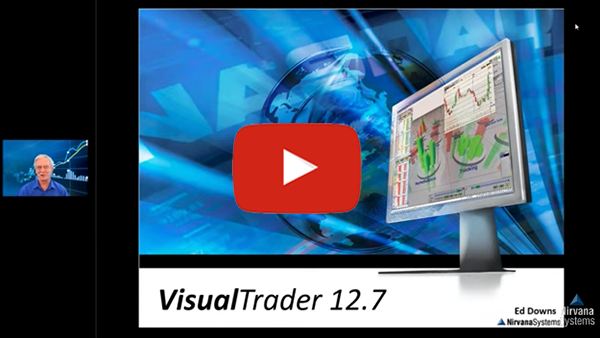
Watch Ed's recorded webinar and see just how powerful The RocketTrade Method really is...in the live market!
“My live brokerage account is up
100% in just over 4 months of trading!”
“My live brokerage account is up 100% in just over 4 months of trading!”
What I discovered is so profound and profitable that I started trading it in October and I am up 100% as of February 12, 2021 (see the record here). I’m so thrilled with Relative Strength that I am converting my 401k so I can trade it, and am also applying it to my wife’s IRA.
An Important Discovery
What I discovered is that Relative Strength is not a number. Rather, it’s an evolving quantity that starts increasing on a stock and as it does so, pulls more institutional buyers in. Recently, this “feeding frenzy” has resulted in some phenomenal gains, with some stocks appreciating 100% - 200% or more in a short period of time.
Solid, Accumulated Relative Strength candidates can be found in any market – you just need the right tools to find and trade them. And that’s what my RocketTrade Method is all about.

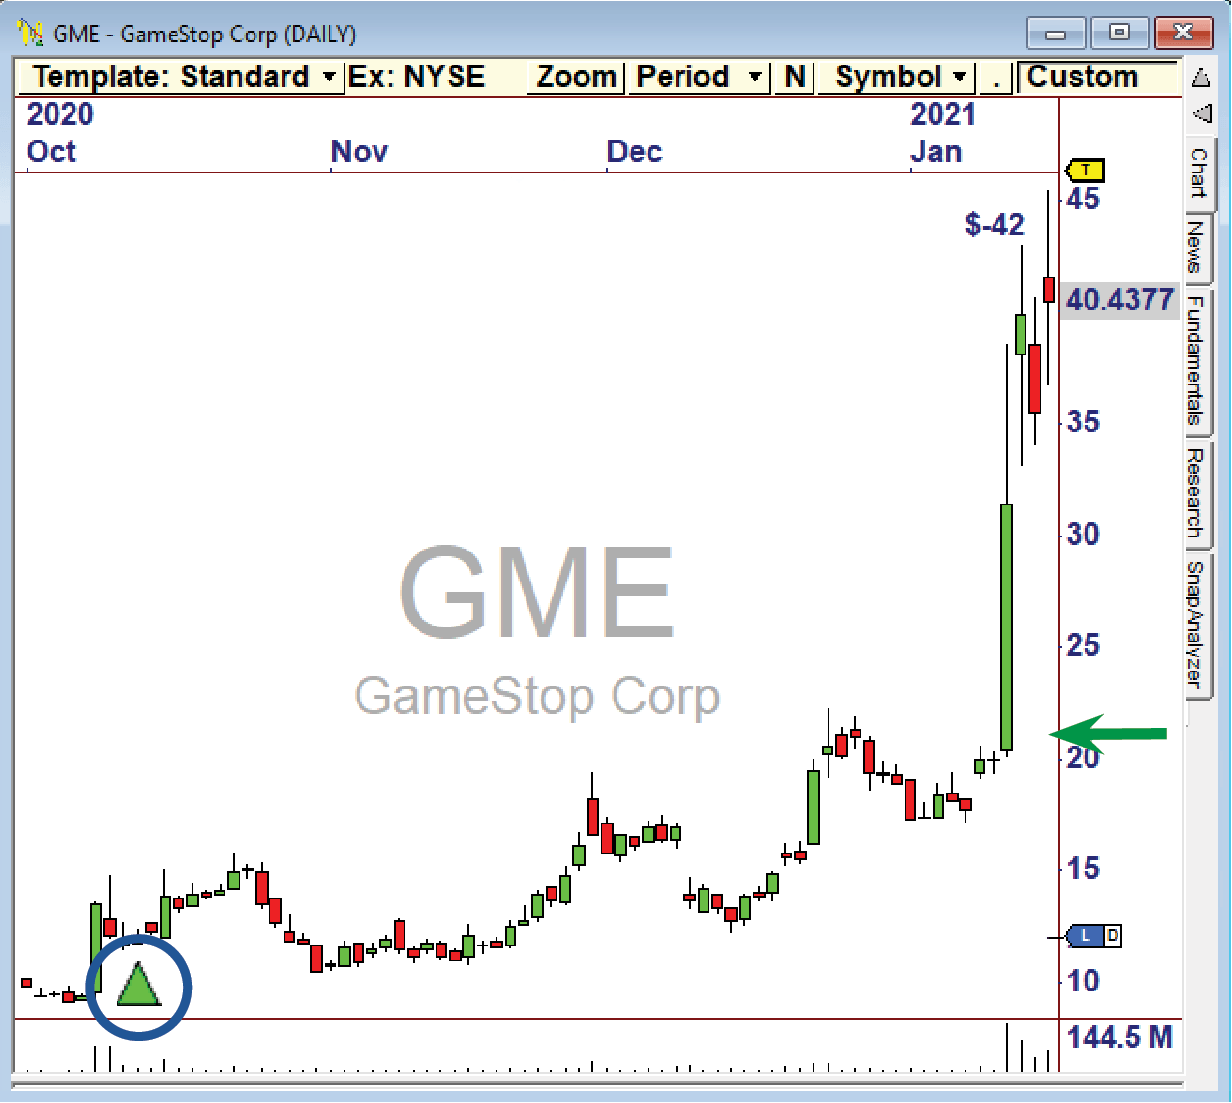
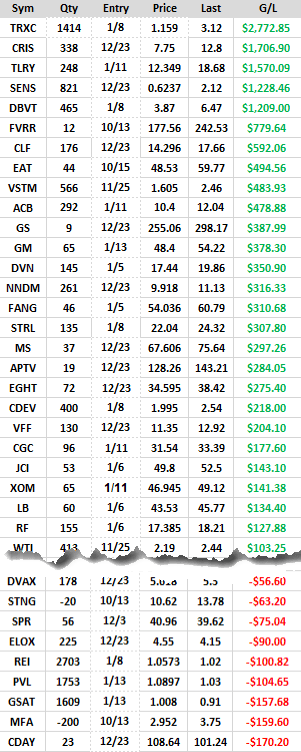
Actual Equity Curve from Gar Wood Securities
Powerful Automation
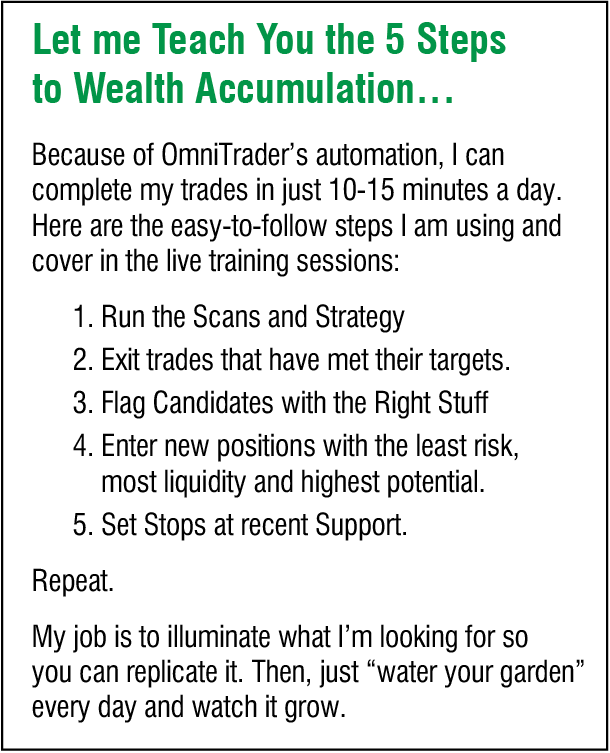
As demonstrated here, the RocketTrade Method is based on proprietary indicators and Scans.These unique assets provide the basis for the Method. OmniTrader is so automated, all a trader has to do is review the candidates and trades each day.
Trading with Relative Strength is Easy!
Let Me Show You…
The real power is in how easy this is. In my three RocketTrade Training Sessions – I will show you how to find and manage great trades in just 15 Minutes a day. I look forward to sharing the Power of Relative Strength so YOU can put this remarkable Method to work for you.
Sincerely,
Ed Downs
Results Speak For Themselves
I have been trading my Relative Strength Method since October. At the start, I experienced a small draw down as I learned valuable lessons (which I will share). Once I did that, trading with the Method became almost too easy.
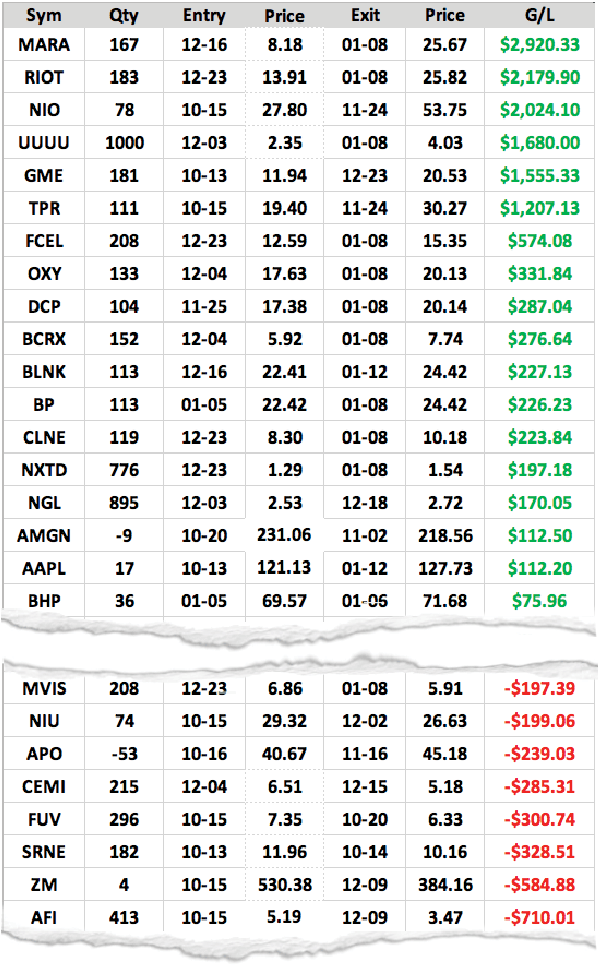
After November 1, there was no looking back. To the right are the closed trades from my live account. The actual Equity Curve from Garwood Securities is shown here.
Anyone Can Trade this Method
One of the hardest decisions in trading is when to get out. Using the techniques I will show you, it’s easy to determine whether a stock is likely to gain more ground or when it is unlikely to go higher and should be sold.
Because the Setup is so powerful, I can go through all the candidates in about 10-15 Minutes. I don’t even have to do it every day. In fact, you can see periods of time when I didn’t trade at all. The point is, on any given day, the trades are there. And some can make huge gains in a matter of days. I call these Rocket Trades.
")
“I’ve seen winner after winner. This is a lot of fun!”- Steve M.
Closed Trades from
October 10 to February 12

Harnessing the Power of Relative Strength
The RocketTrade Method is based on Nirvana’s Relative
Strength Plug-In and is composed of 4 parts:
1. Indicators 2. Scans 3. Strategy 4. RocketTrade Training
While it is not necessary for traders to fully understand each part, it’s important to show how they combine to make the RocketTrade Method so unique and valuable. Here is a summary of the four components, which are described in more detail in the following few sections.
1. Indicators
The classic ways of calculating Relative Strength only show instantaneous values and do not show when a stock is under Accumulation. These NEW Relative Strength Indicators are used in both the OmniScans and the Strategy. They also visually show the degree to which Accumulated Relative Strength has built up in a chart.
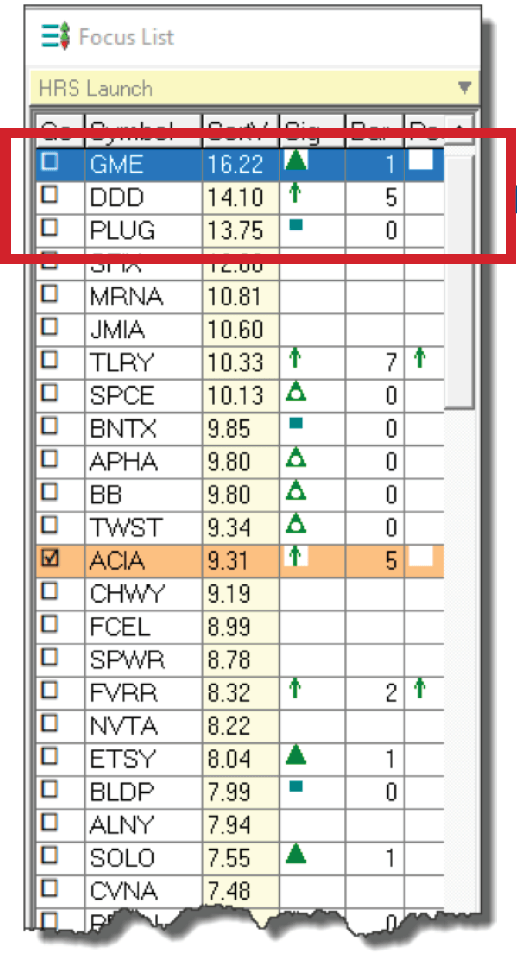
2. OmniScans
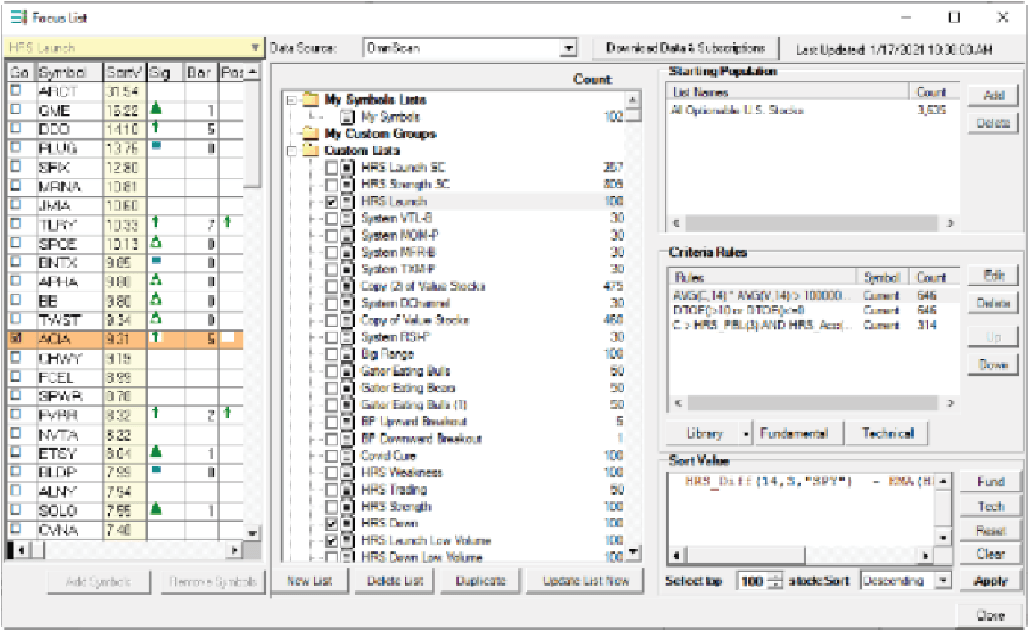
Using the Relative Strength Indicators, the provided OmniScans can identify those stocks that have the highest Relative Strength, and are in a Launch pattern. If you review the trades that have been identified, the power of these scans is obvious.
The Strategy’s job is to find optimal entry points once a stock has been identified as being under accumulation by market participants. The Signals from the Strategy save time when reviewing candidates and provide the best possible entry points.
While the components of Relative Strength are powerful, there are specific chart clues that enhance results while trading. In Ed’s 3-Part Training Series, “The RocketTrade Method”, he demonstrates the precise steps he took to grow an account more than 50% in a short period of time while managing risk, in just 10-15 Minutes a day. See here for an overview of this valuable content.
1. The Indicators
The Essence of the RocketTrade Method
I researched two key concepts that led me to create the Relative Strength indicators used in the Method.
The first indicator measures the difference between the current Relative Strength and prior values of Relative Strength, and is thus called the “Difference” indicator.
The Color Chart to the right shows the positive (green) and negative (red) Relative Strength difference measurements. The transition between red and green indicates an increase or decrease of this measurement. The accumulation of these values is used in theAccumulation indicator (discussed next).

Another indicator I developed measures the accumulation of Relative Strength and is called the “Accumulation” Indicator. It basically indicates when Relative Strength is accumulating or not, by virtue of the Blue Line being above or below zero.
When the Blue Line is above zero for a period of time, we know the stock is in an accumulation mode, and the reverse for a distribution mode, making it easy to Scan for candidates each day.
Learn about the unique OmniScans that use this indicator here.
Measuring Distribution

The Accumulation Indicator goes negative for LNT in lateNovember, showing weakness that continued from there.
Measuring Accumulation

In DDD, we see the Accumulation indicator trending up above zero since early November – an indication the stock would continue up.
2. The Scans
Find the Best Candidates – Automatically
OmniScan is one of the best tools in OmniTrader. WithScans, I can get my trading done in just 10-15 Minutes each day. These RS Scans will deliver the most explosive candidates you have ever seen, ready for the Strategy to generate great Signals on them.
The two primary Scans are “Launch” and “Down”, which show the candidates that are suddenly gaining strength or getting very weak (relative to the market).
There are also “Low Cap” and “High Cap” versions, because the largest short term gains are typically generated by theLow Cap stocks, with slightly higher risk. Users can trade one or the other based on their personal risk tolerance. To the right is a Launch Scan run, with the top charts below. The potential of these stocks to appreciate is revealed in the setup!


3. The Strategy (Signals)
Excellent Entry Signals
While we certainly can look through all the candidates generated by the OmniScans (and some users do this), a huge time savings is generated by running the Strategy provided with the RocketTrade Method.
The Strategy looks for candidates with the highest Relative Strength that are turning up off a Moving Average. This often results in candidates that “run” which is where the bulk of the profits come from.
In the training sessions, Ed shows examples of how to select the best candidates from the Entry Signals presented in the Focus List. Part of the process is identifying chart clues that indicate they are likely to go higher.
Ed uses the Signals and Scans to do this in about 10-15 minutes a day across all candidates in the entire market. So far, the results speak for themselves! See Open Positions as of February 12 here.

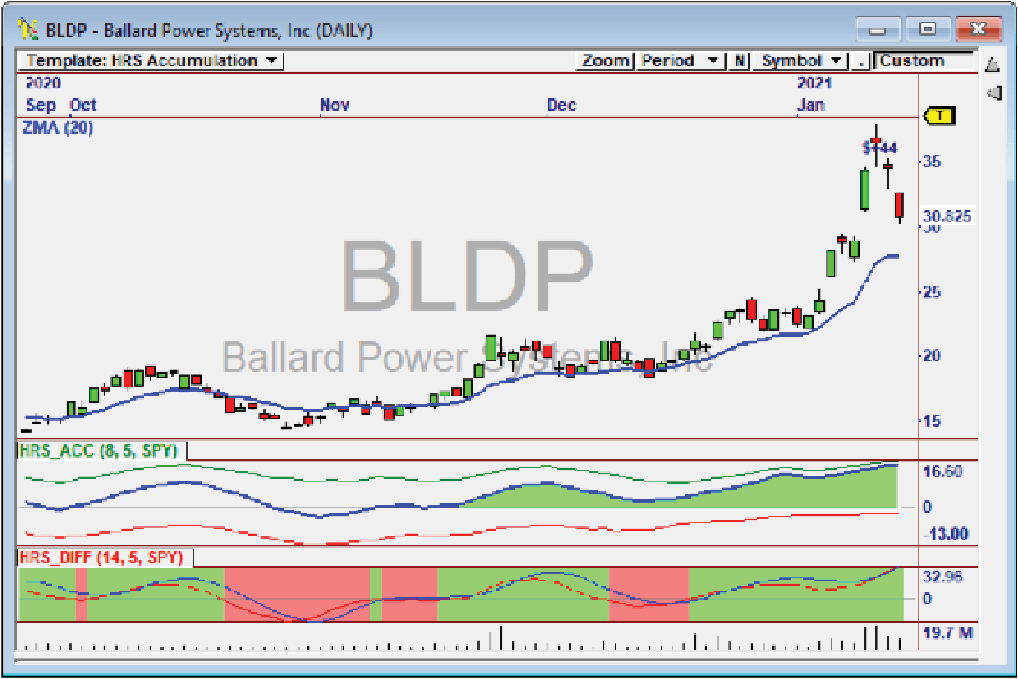
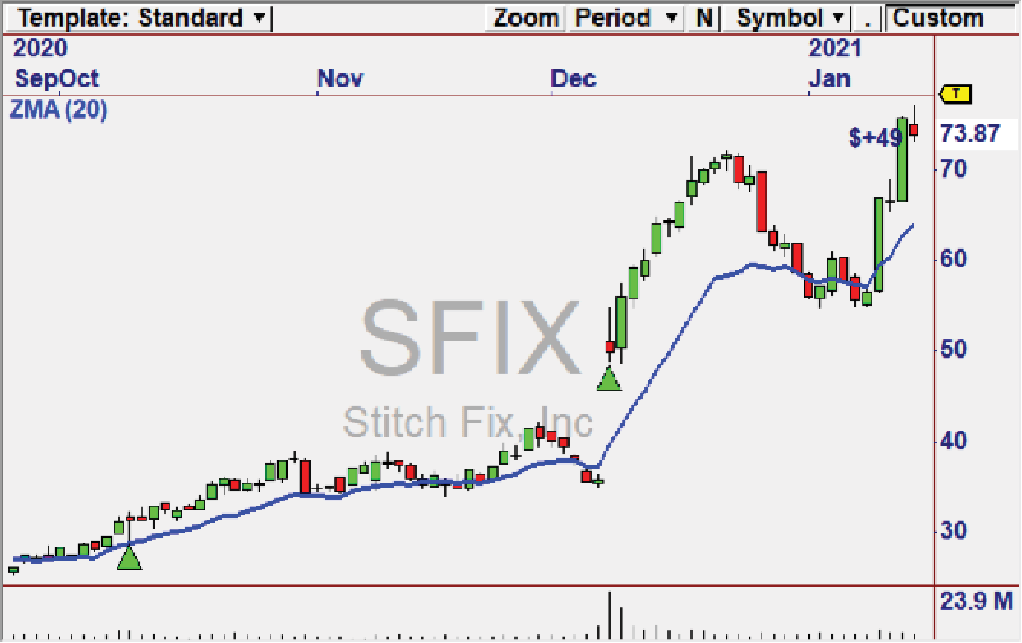
The chart for PLUG shows the Power of the Strategy coupled with Relative Strength combination. You can see solid green for 2 months where Accumulated RelativeStrength is above zero, coupled with pull-backs to theZMA for the Signal. Time and time again, this combination results in EXPLOSIVE moves.
Recent Signal Examples


4. Ed's RocketTrade Method Training
THREE Training Sessions


"Let me show you how YOU can Harness the Power in YOUR account!”
My training sessions come with the RocketTrade Method. In it, I disclose PRECISELY how I have been using Relative Strength to make consistent gains in the current market.
While I can’t guarantee gains, I CAN guarantee you will get really excited about what you see - providing the motivation to stay with the program and keep going.
-
Part 2: Watering the Garden
-
Part 3: Reducing Risk
Part I: Finding the Rocket Trades
One of the secrets to my success is the accumulation of potential and mitigation of risk through incremental diversification and trade management.
By periodically adding positions that have the “Right Stuff”, while dropping out of those that are unlikely to appreciate further, I’ve been able to steadily grow my account.
Relative Strength makes it easy to find stocks that are being accumulated by market participants.


The Goal: Relax and Enjoy Life!
The fact is, you don’t have to do this every day. If you look at my trade record, you will see I skipped trading for many days. With reasonable profit and loss stops at the broker, you can relax between sessions.
I love the fact that my money is working for me in the market, made possible by the advanced automation that OmniTrader provides, and the Rocket Fuel that is Relative Strength!
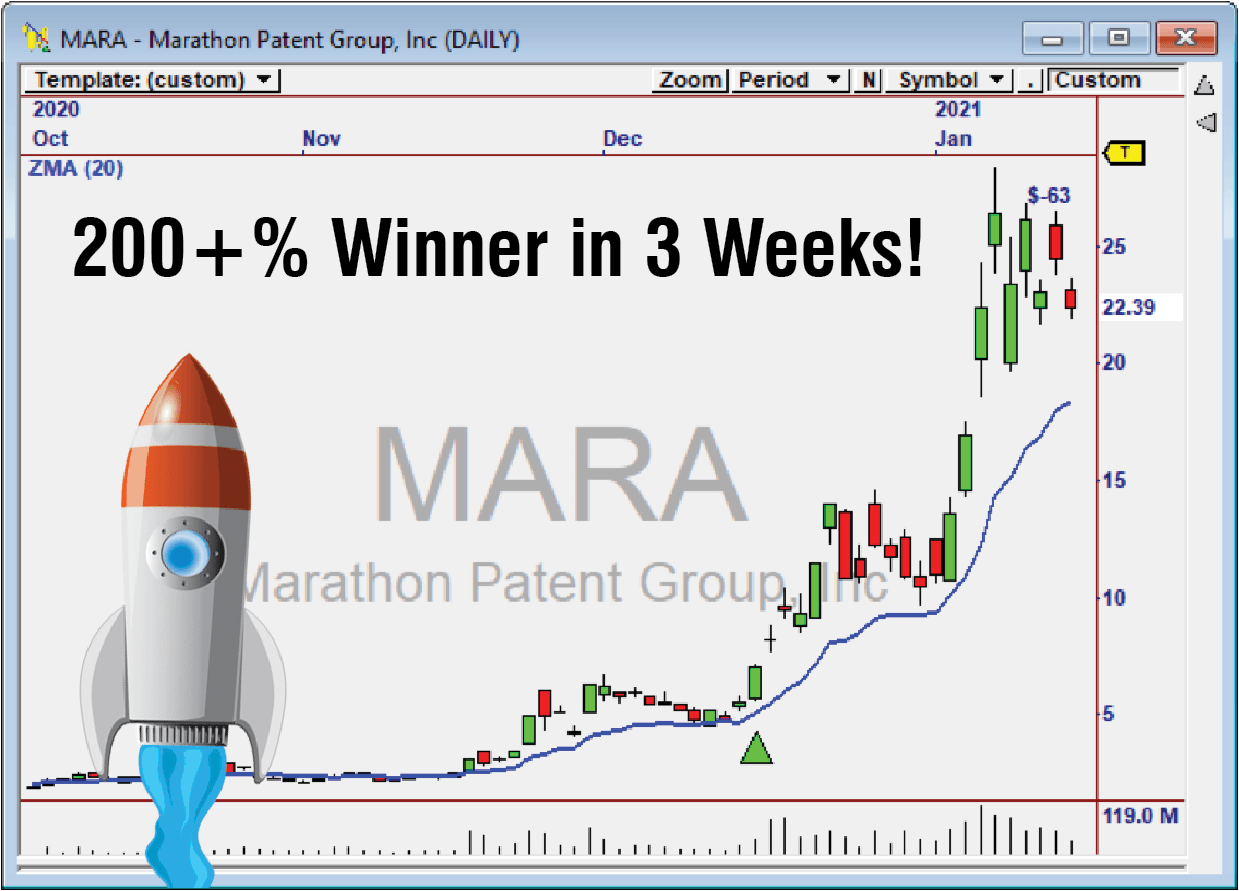
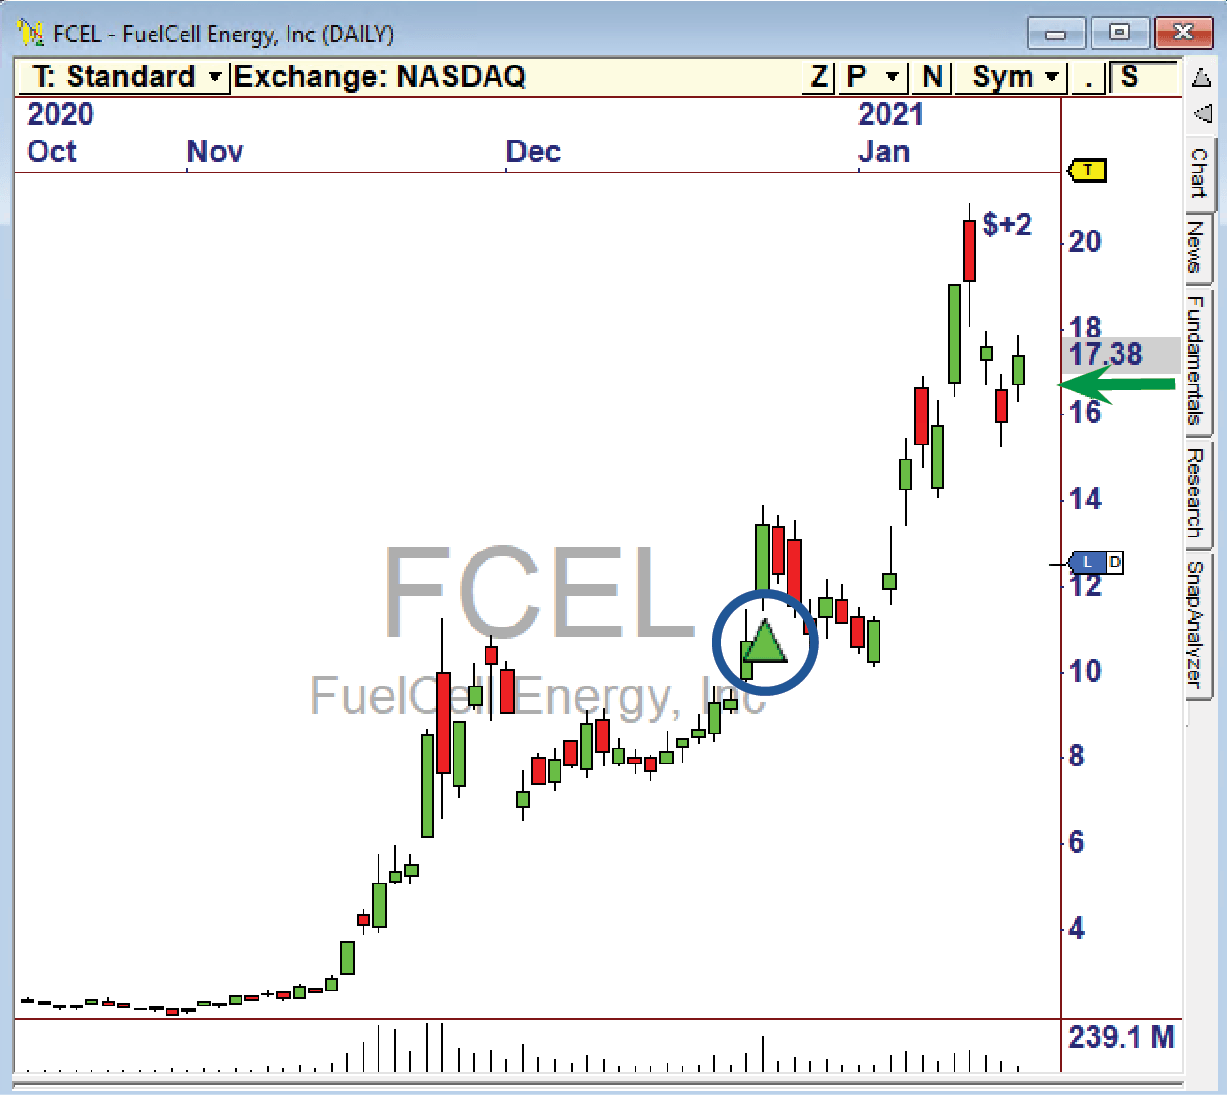
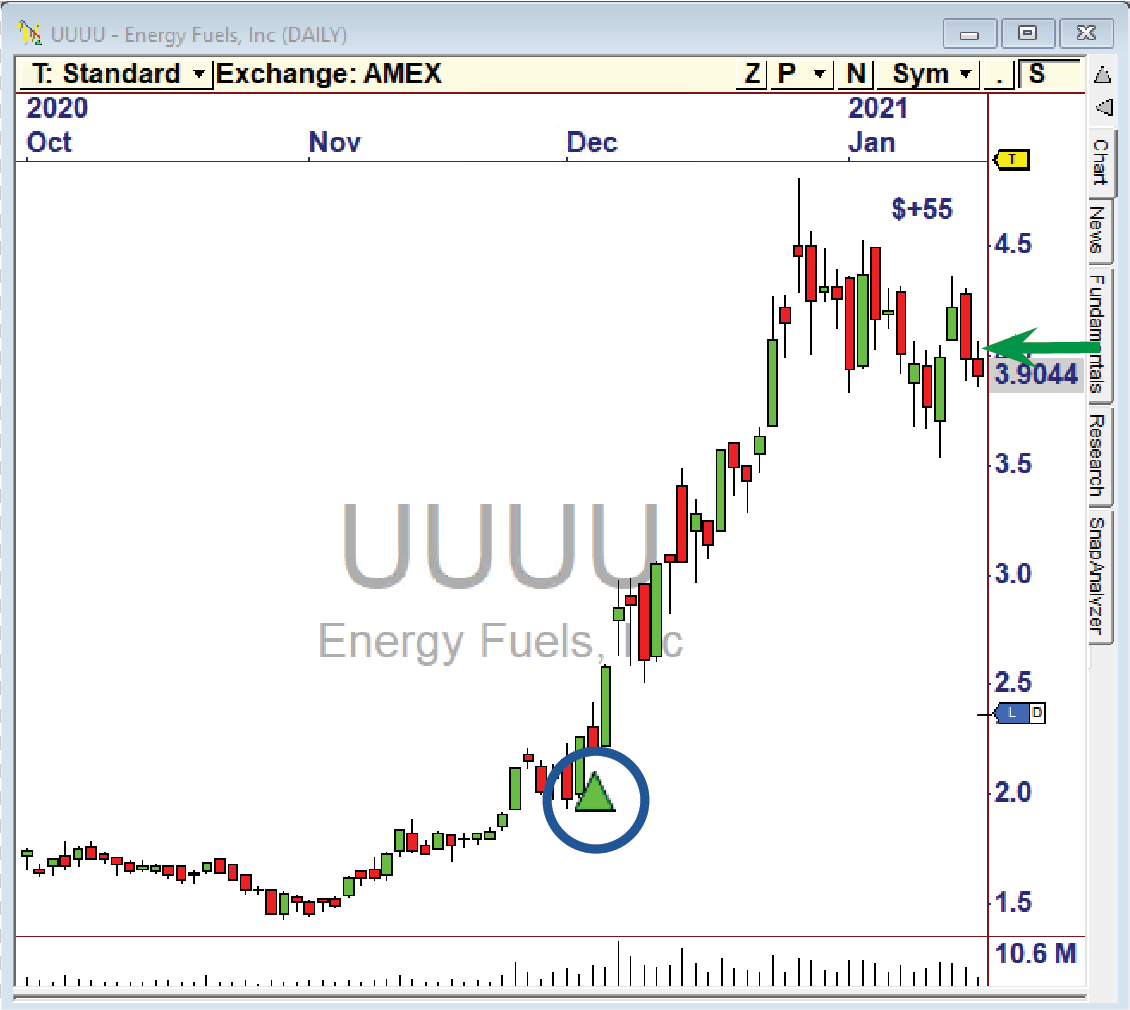
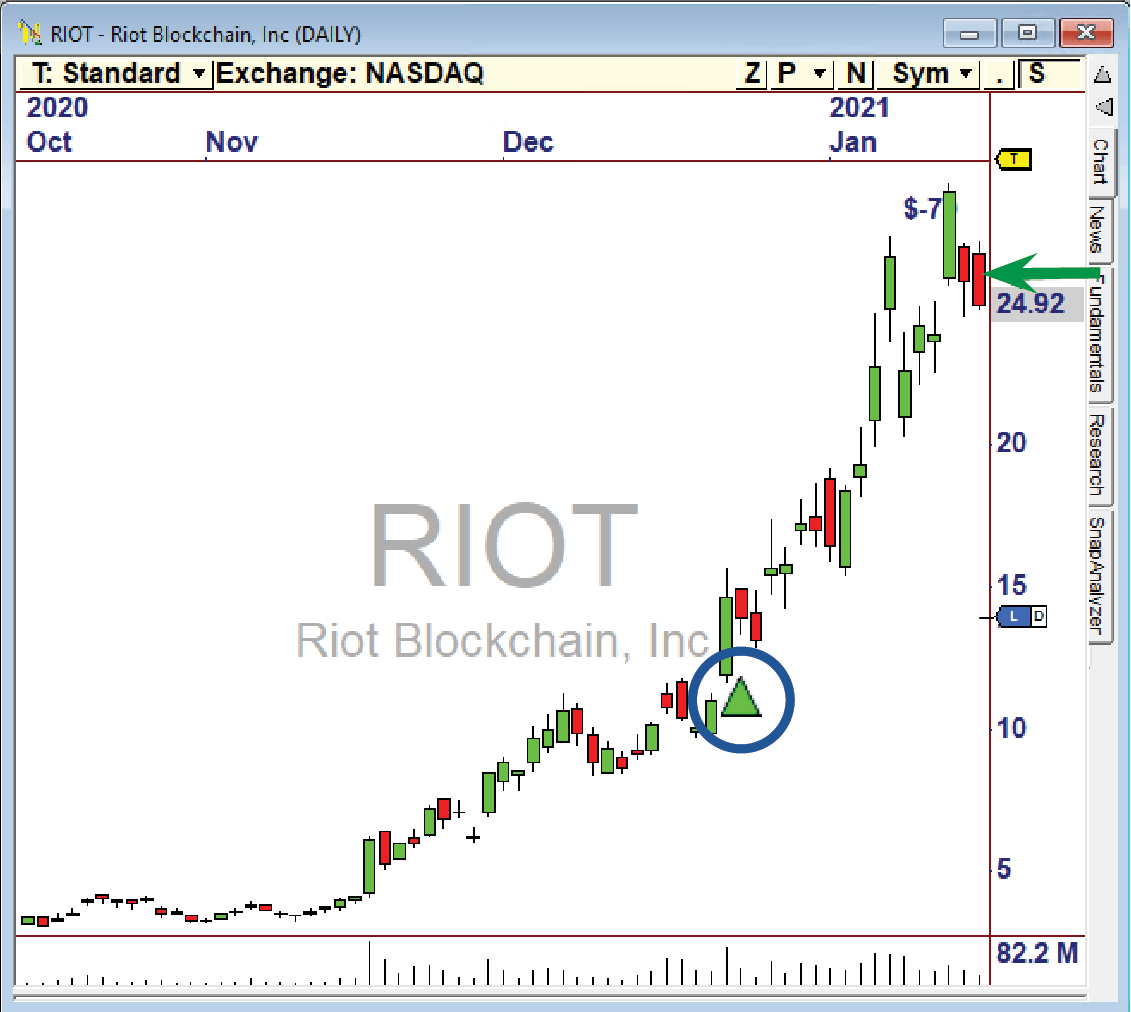
Recent Trade Examples
It’s easy to see the explosive nature of these trades.


A Partial List of Open
Positions as of February 12, 2021

“Let Me Show YOU How to RocketTrade!”
My job as CEO of Nirvana is to make great software - not to be a trader! But once I saw how much these Relative Strength trades could make, I decided to start trading them. I didn’t set out to generate a 50% return, but was thrilled when I did! It was an easy decision to share what I had learned with our loyal OmniTrader users. The RocketTrade Package includes great software and the best approach to trading I have ever seen. I know you will profit from it!
The RocketTrade Method Includes…
Nirvana’s Relative Strength Plug-In
Our “Harness the Power of Relative Strength” Plug-In includes all the assets described here.
• Proprietary Relative Strength Indicators.
• Powerful OmniScans that find stocks with the highest Relative Strength.
• Signal-Generating Strategies and a Profile.
Price (If purchased separately).........................................................$995
LIVE and Recorded RocketTrade Method Training
Educational series, with Recordings available on your Product Dashboard after the event, to refresh your knowledge any time.
• Part I – “Finding the Launch Trades” - Introduction & training on how to find the powerful “Launch Candidates” and add them to your Portfolio.
• Part II – “Growing Your Garden” - Step-by-Step Instructions on how to manage your trades from day to day to maximize profits.
• Part III – “Reducing Risk” - We cover several great ways to reduce risk, including trade balancing and hedging with other instruments.
• INCLUDES Nirvana’s Relative Strength Plug-In.
Price (Including Relative Strength).................................................$1,495
Introductory Special · Just $995

Our software is backed by our unconditional 30-Day Money Back Guarantee.
Important Information: Futures, options and securities trading has risk of loss and may not be suitable for all persons. No Strategy can guarantee profits or freedom from loss. Past results are not necessarily indicative of future results. These results are based on simulated or hypothetical performance results that have certain inherent limitations. Unlike an actual performance record, simulated results do not represent actual trading. There are numerous market factors, including liquidity, which cannot be fully accounted for in the preparation of hypothetical performance results all of which can adversely affect actual trading results. No representation is being made that any account will or is likely to achieve profits or losses similar to these being shown.