


iTLB 3.0
$395
Compatible Platform: OmniTrader / VisualTrader
Recommended Data: End Of Day / Real Time
iTLB 3 finds reversals EARLIER & FASTER than ever! We all want to catch the first bar of a new move. In fact, if we could catch it one or two bars AHEAD of the move, that would be fabulous! That’s exactly what the iTLB 3 plug-in is designed to do!
Indicator Trend Line Break 3.0
Nirvana's Indicator Trend Line Break 3.0 (iTLB) Plug-in automatically generates Trend Line Breaks on Indicators and Moving Averages to provide early confirmed Signals ahead of the big moves.
▲ NEW! Trend Line Breaks on Moving Averages.
▲ Automatically generates Trend Line Breaks on indicators.
▲ Provides early confirmed Signals ahead of the big moves.
▲ Finds reversals in just about any liquid market.

Take a Look at What's in iTLB 3.0
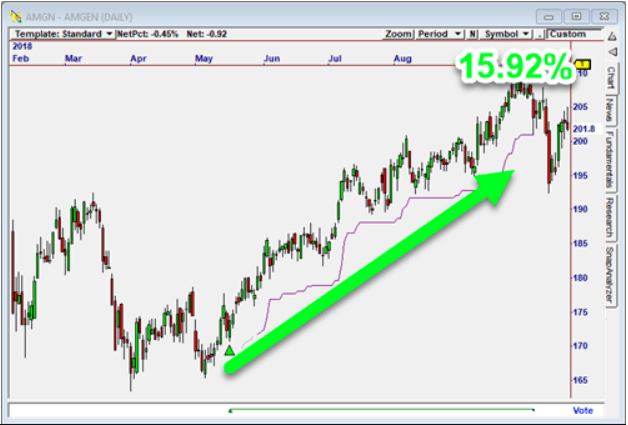
Razor Sharp Reversals
Many indicators provide leading information. Take Momentum for example. This popular indicator measures the movement of prices up or down, forming a plot that rises or falls between two values. What happens if price stops going down?
Notice I didn’t say, “What happens if price reverses?” I said, “What happens if price stops going down?” There is a big difference. When price stops going down, momentum turns up, and you can see that in the indicator.
But we only want to trade the best and “sharpest” reversals, which generally occur when Momentum and other indicators decisively break a prior trend. What is the best way to determine a sudden change in trend? A Trend Line Break, of course!
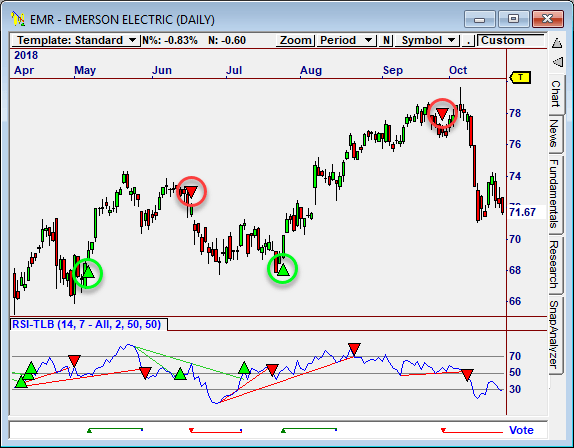
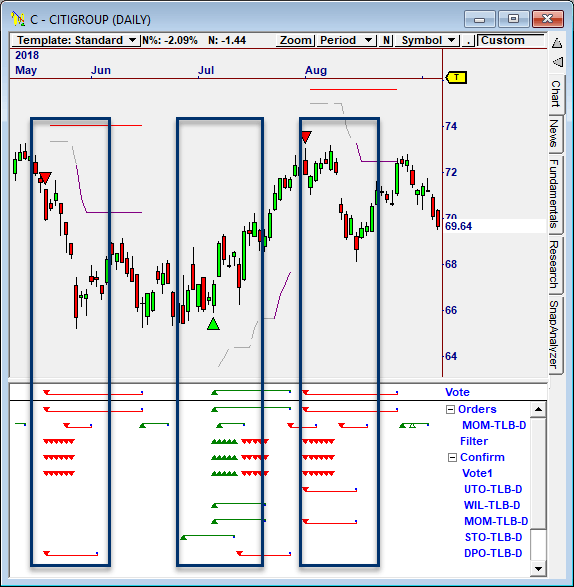
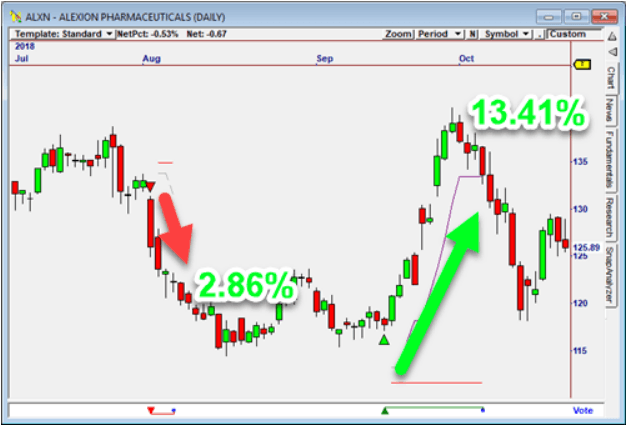
Outstanding Reversal Signals
The iTLB Strategies work amazingly well on stocks. The chart below shows how well iTLB Strategies can find powerful reversals. In the chart shown, the July upturn in Citigroup was detected when 3 of the systems fired Long within a few bars.
The iTLB concept also works well on Mutual Funds. Mutual Funds can hold trends for long periods of time and then suddenly reverse. The iTLB method catches these reversals, allowing investors to switch between Mutual Funds at optimal times.
The iTLB 3.0 plug-in is a powerful addition for your OmniTrader tool box. The great thing about OmniTrader is you can activate these Strategies in addition to others you are already using to find the earliest confirmed reversals in your list. iTLB finds reversals quicker than any other method!
Bull and Bear Power Strategy
In iTLB 3.0, we have added a new TLB System based on the Bull Power and Bear Power indicators, built by subtracting the 13-day Exponential Moving Average from the day’s high or low. This creates an oscillator that lends itself well to TLB analysis.
This new system does a fabulous job of picking early entry points. In recent testing on the S&P 100 we were seeing Hit Rates above 80% for Longs!
The iTLB systems generate higher odds of calling reversals than any other system in the standard OmniTrader collection, which means your odds of winning are greatly improved. Combine them with other indicators and methods (such as chart patterns) for highly confirmed reversal opportunities.
Sweet Trading Seminar
Swing Trading is the essence of our Trade the Moves concept. In conjunction with the release of iTLB 3.0, Jeff Drake created a info -packed Seminar titled Profitable Swing Trading based on the iTLB concept.
While the seminar does illustrate use of the iTLB 3.0 Plug-in, it is much more than user manual. It's a comprehensive review of profitable Swing Trading methods, focused on using the iTLB concept for low-risk Entries. Once an Entry Signal is identified, Trade Management becomes very important. An entire section is devoted to this topic.
This seminar will help any customer who is engaged in Swing Trading to understand what the best setups look like, and how to trade them. It's a great addition to the iTLB 3.0 Suite, and can e acquired with the plug-in.
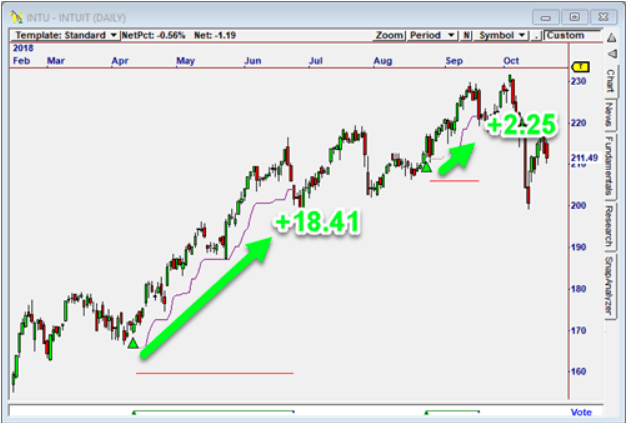
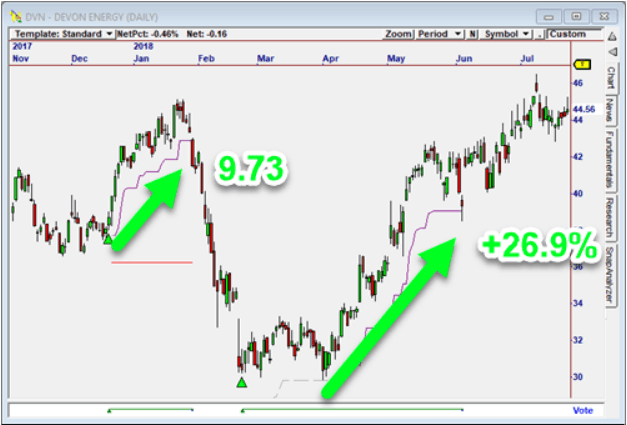
iTLB 3.0 Signature Trades
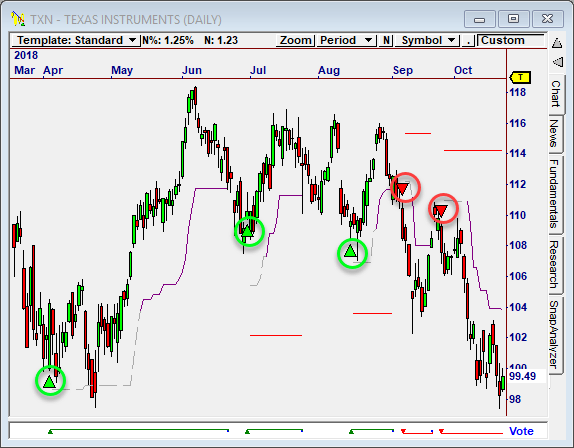
Moving Average Breaks
Linear Regression Histogram
Momentum
Combine Strategies for Better Results
The Commodity Channel Index (CCI) is another indicator that cycles between overbought and oversold levels. Here is the CCI-TLB system, illustrating profit table reversals on HNZ.
After several months of programming and testing, our development team created the first indicator Trend Line Break Plug-in based on the concept of confirming trades with a new kind of pattern. The original iTLB quickly became our number one bestseller with thousands of dedicated OmniTrader users. These are some of the most profitable Strategies we have ever developed. And now, with the addition of Trend Line Breaks on Moving Averages and the new Bull/Bear iTLB Strategy, it’s unbelievable!
Included in iTLB 3.0 is the iTLB2 Power Strategy – a non-optimized Strategy that continues to show a consistent 70% accuracy over years of testing.
The iTLB Systems do an amazing job of finding reversals in any liquid market. As Indicators move from oversold to overbought levels, Trend Lines drawn across the Indicators signal reversals when the lines are broken. These Signals are both earlier and better confirmed than any other approach we have used or seen. The iTLB Systems generate higher odds of calling reversal than any other system in the standard OmniTrader collection, which means your odds of winning are going to be improved.
Plug iTLB 3.0 into OmniTrader and run your own performance tests. You won’t believe how good these Strategies are!
THE EARLY BAR GETS THE $$$!
The new Bull & Bear Power iTLB Strategy generates longer term signals, using the Bull Power and Bear Power indicators to identify overbought and oversold levels. Trading Signals just don’t get much better than this!

Strong Performance
The iTLB Strategies shown here generated 70% to 80% Hit Rates from 5/1/09 to 5/1/10 when tested against stocks in the S&P 100 index.
The new iTLB Strategies were over 75% accurate (statistics generated for Long trades only), with iTLB Bull/Bear generating an accuracy of 82%!
These statistics are impressive when you consider the fact that these are mechanical strategies!
Important Information: Futures, options and securities trading has risk of loss and may not be suitable for all persons. No Strategy can guarantee profits or freedom from loss. Past results are not necessarily indicative of future results. These results are based on simulated or hypothetical performance results that have certain inherent limitations. Unlike an actual performance record, simulated results do not represent actual trading. There are numerous market factors, including liquidity, which cannot be fully accounted for in the preparation of hypothetical performance results all of which can adversely affect actual trading results. No representation is being made that any account will or is likely to achieve profits or losses similar to these being shown.