


This Mobile
Page is Under Construction
The mobile version of this webpage
is still under construction.
Please visit the desktop site on your
computer or laptop in the meantime.
Thank you!
800-880-0338 or 512-345-2566
Please feel free to contact Angela, Scott, or Nathan with any questions you might have. Whether you are a new customer, or a long-time customer, you are important to us!
Monday - Friday, 8am to 5pm
The Power to Trade with Confidence
ETF Consensus Trader for VisualTrader
The Power to Trade with Confidence
ETF Consensus Trader for VisualTrader
ETF Consensus Identifies the Strongest Groups AND the Strongest Stocks within them!
The Great Trades
Come to you!
Real Time
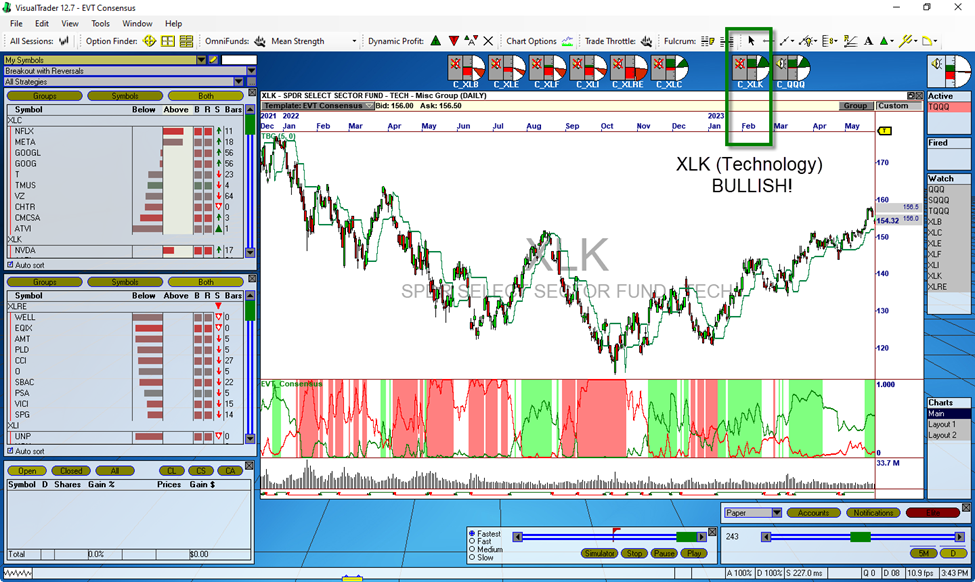
VisualTrader is designed from the ground up to trade the Power of Group Consensus.
The Leading Indicator makes it easy to see when a group is moving.
Once you decide to enter, automatic Strategies manage the trades.
Never miss another Big Move again!
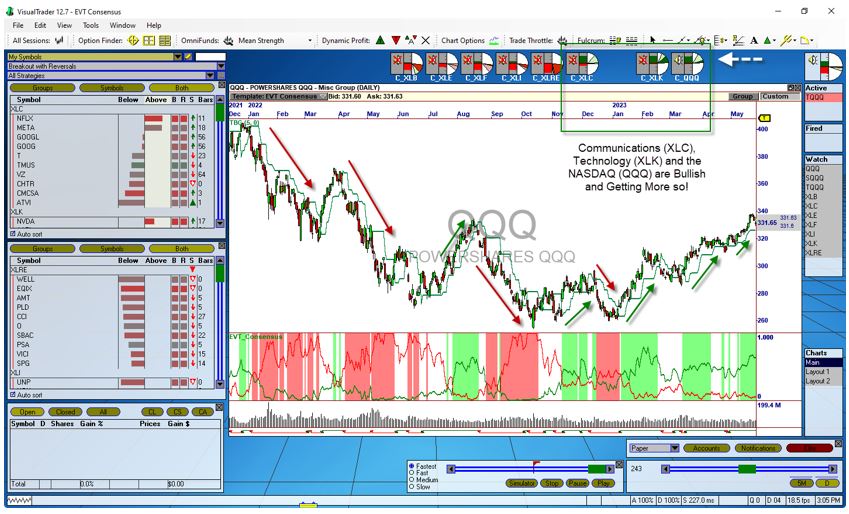
End of Day Chart of QQQ with Leading Indicator and Bull/Bear Zones Marked
End of Day or
Real Time ETF Consensus Shows YOU The Way.
End of Day
The Leading shows Bullish and Bearish Action Zones where the stocks in the index are likely to go up or down. We use ETFs because they serve a dual purpose.
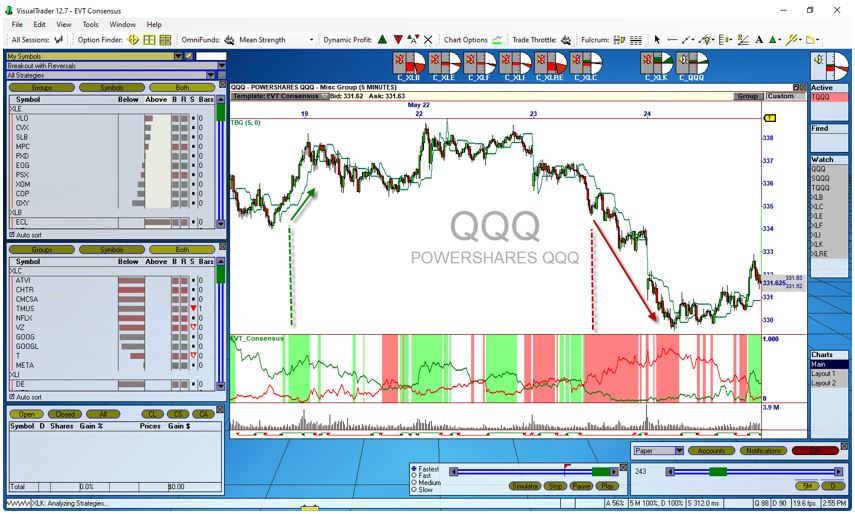
Real Time Chart of QQQ with Leading Indicator and Bull/Bear Zones Marked
ETF Consensus Identifies the Strongest Groups AND the Strongest Stocks within them!
The Great Trades Come to you!
Real Time
VisualTrader is designed from the ground up to trade the Power of Group Consensus.
The Leading Indicator makes it easy to see when a group is moving.
Once you decide to enter, automatic Strategies manage the trades.
Never miss another Big Move again!
End of Day Chart of QQQ with Leading Indicator and Bull/Bear Zones Marked
End of Day or Real Time ETF Consensus Shows YOU The Way.
End of Day
The Leading shows Bullish and Bearish Action Zones where the stocks in the index are likely to go up or down. We use ETFs because they serve a dual purpose.
Real Time Chart of QQQ with Leading Indicator and Bull/Bear Zones Marked
“So Powerful,
I filed for a U.S. Patent on it.”
Ed Downs
“So Powerful, I filed for a U.S. Patent on it.”
Ed Downs
What Is the “Leading Indicator”?
The Leading Indicator is a new invention that measures the direction of movement of an ETF by measuring Positive and Negative Movement within the ETF.
When Positive Movement is increasing and Negative Movement is decreasing, a bullish move in the industry group is almost always underway.
Positive and Negative movement are shown separately, as well as the combined value and change within the last bar. Those that are changing rapidly are the most bullish (or bearish) groups.

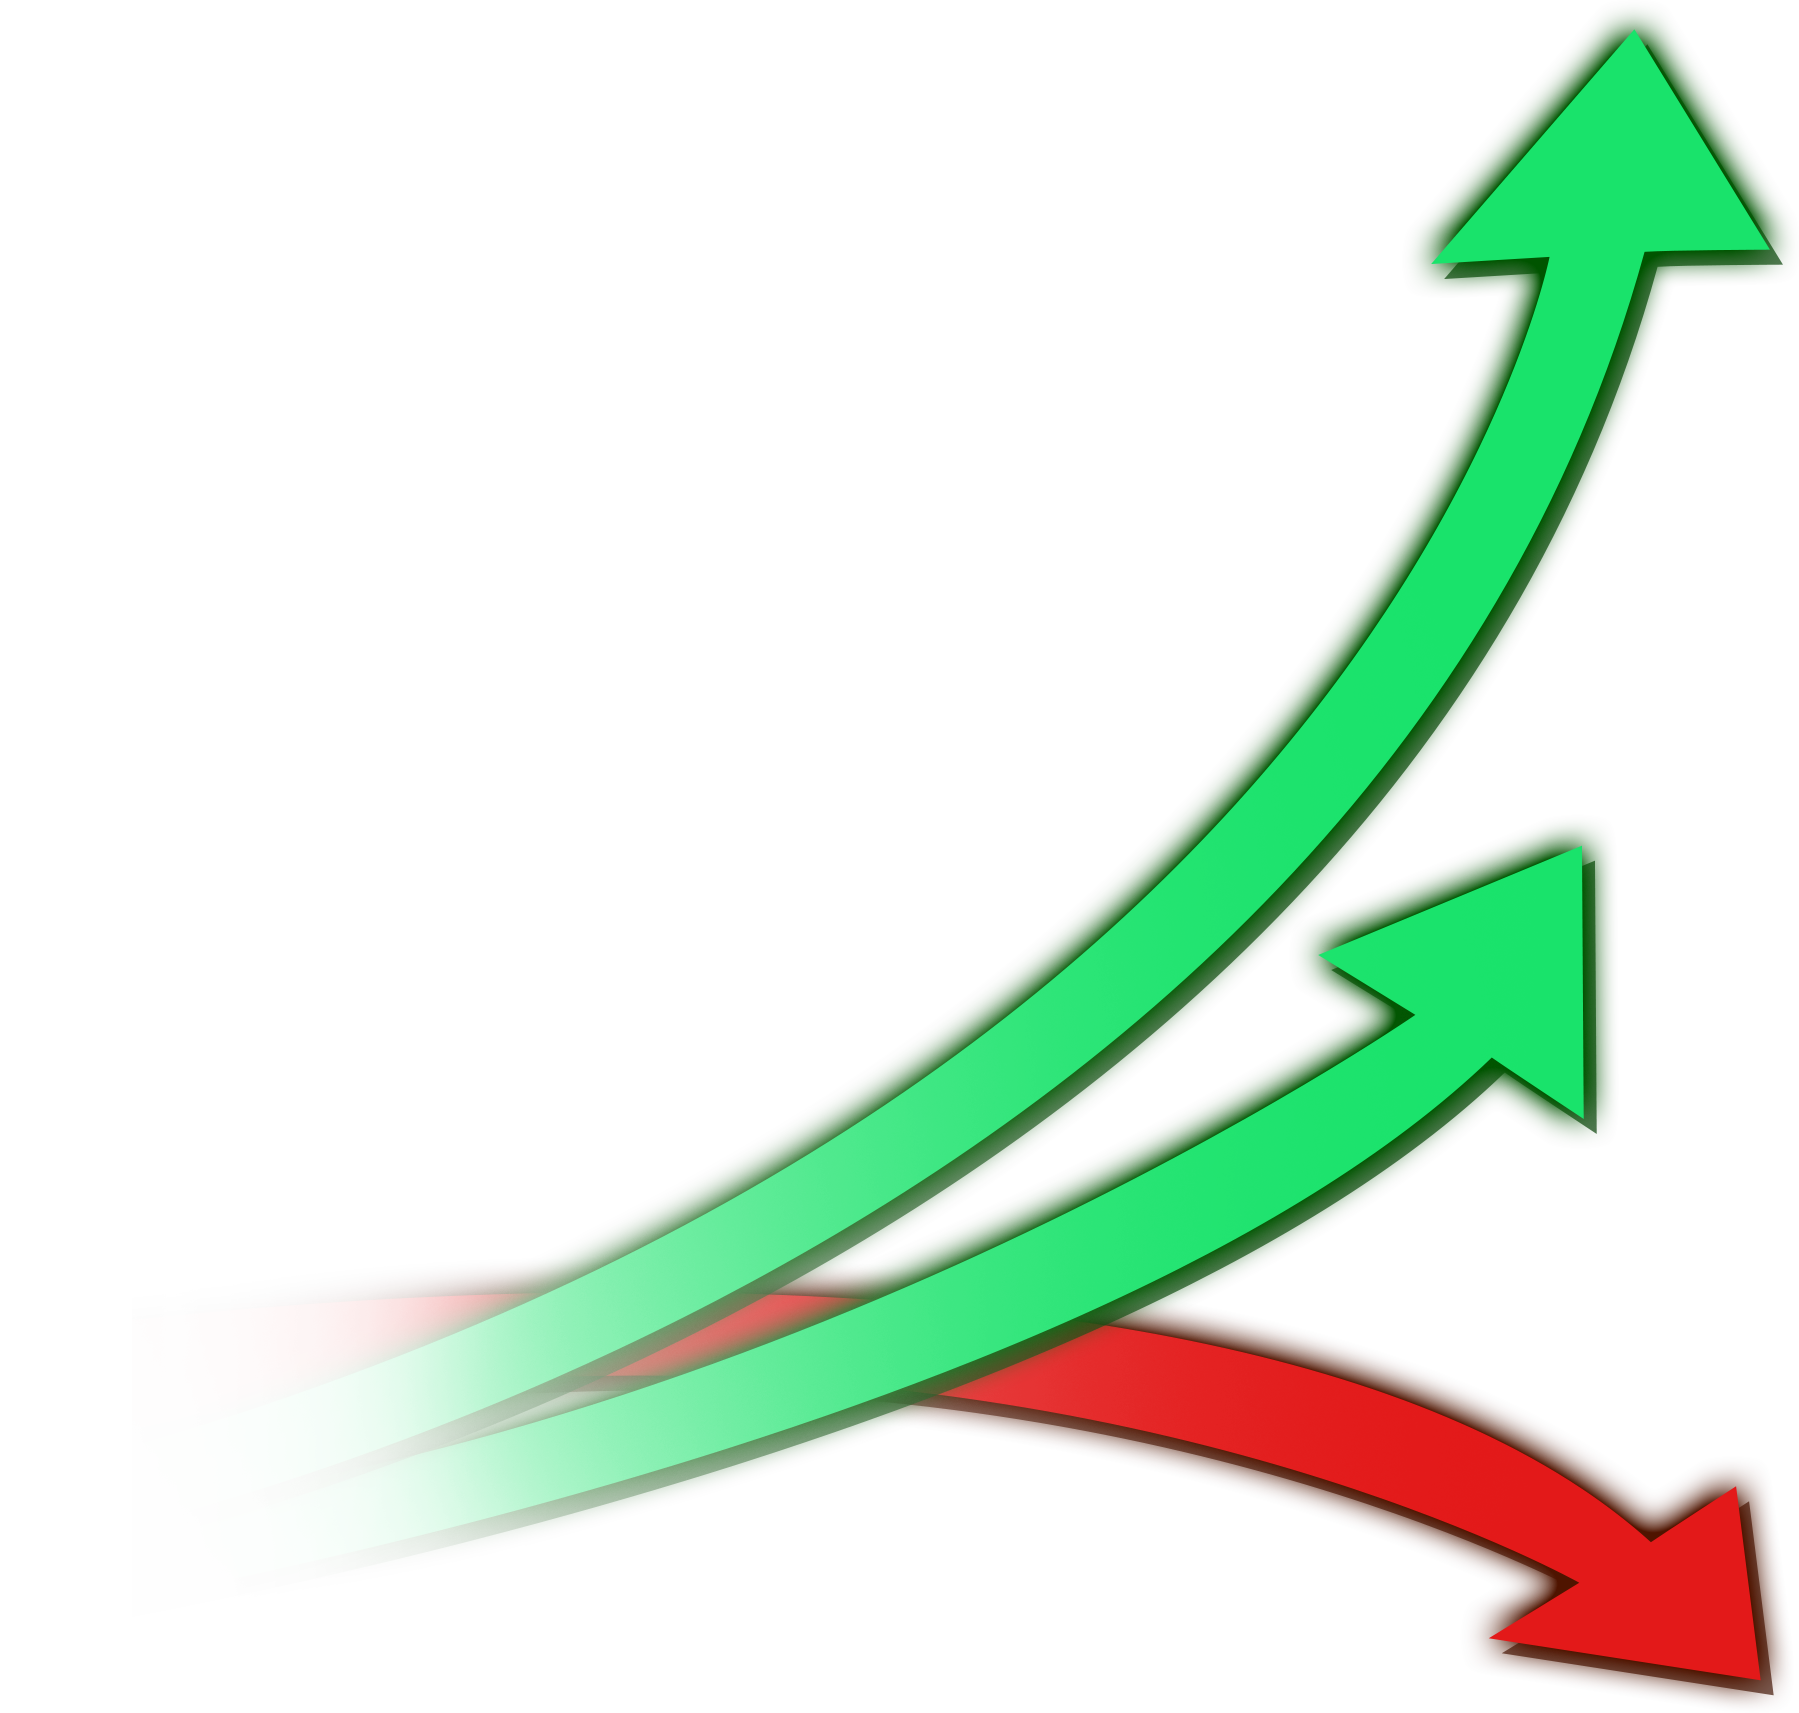
More Green than Red = Slightly Bullish

More Green Less Red = More Bullish

No Red at all= Very Bullish
What Is the “Leading Indicator”?
The Leading Indicator is a new invention that measures the direction of movement of an ETF by measuring Positive and Negative Movement within the ETF.
When Positive Movement is increasing and Negative Movement is decreasing, a bullish move in the industry group is almost always underway.
Positive and Negative movement are shown separately, as well as the combined value and change within the last bar. Those that are changing rapidly are the most bullish (or bearish) groups.
More Green than Red
= Slightly Bullish
More Green Less Red
= More Bullish
No Red at all
= Very Bullish
See it in Action!
The Leading Indicator
How It Helps You Make Money
in Your Trading
This 12 Minute video shows how The Leading Indicator predicts moves and explains how it's used in the NEW Mobile App!
See it in Action!
The Leading Indicator
How It Helps You Make
Money in Your Trading
This 12 Minute video shows how The Leading Indicator predicts moves and explains how it's used in the NEW Mobile App!
ETF Consensus
Trader for VisualTrader
the ETF Consensus Trader also grants you access to our exclusive ETF Consensus Mobile App.
The ability of ETF Consensus to help you see the Big Moves before they happen is unprecedented. There is nothing like it! As part of our Introductory Offer, you can save even more....

Discover the Power of Consensus Trading Today!
Take Your Trading Experience And Outcomes To New Heights With
The ETF Consensus Trader Today!
ETF Consensus Trader
for VisualTrader
the ETF Consensus Trader also grants you access to our exclusive ETF Consensus Mobile App.
The ability of ETF Consensus to help you see the Big Moves before they happen is unprecedented. There is nothing like it! As part of our Introductory Offer, you can save even more....
Discover the Power of Consensus Trading Today!
Take Your Trading Experience And Outcomes To New Heights With The ETF Consensus Trader Today!
Need Anything? We are Happy to Help!
Please feel free to contact Angela, Scott, or Nathan with any questions you might have. Whether you are a new customer, or a long-time customer, you are important to us!
Visit:
www.nirvanasystems.com/contact/
or contact us at 800-880-0338.
Monday - Friday, 8am to 5pm
Need Anything? We are Happy to Help!
Please feel free to contact Angela, Scott, or Nathan with any questions you might have.
Whether you are a new customer, or a long-time customer, you are important to us!
Visit www.nirvanasystems.com/contact/ or contact us at 800-880-0338.
Monday - Friday, 8am to 5pm
Our software is backed by our unconditional Money Back Guarantee. If for any reason you are not fully satisfied, you may return the software, within 30-days of purchase, for a 100% refund. Texas residents add 8.25% sales tax.
Important Information: Futures, options and securities trading has risk of loss and may not be suitable for all persons. No Strategy can guarantee profits or freedom from loss. Past results are not necessarily indicative of future results. These results are based on simulated or hypothetical performance results that have certain inherent limitations. Unlike an actual performance record, simulated results do not represent actual trading. There are numerous market factors, including liquidity, which cannot be fully accounted for in the preparation of hypothetical performance results all of which can adversely affect actual trading results. No representation is being made that any account will or is likely to achieve profits or losses similar to these being shown.