


ETF Consensus Trader
Featuring : The
Leading Indicator
“The best indicator
I have ever seen.”
- Larry Luck
ETF Consensus Trader
Featuring : The Leading Indicator
“The best indicator I have ever seen.”
- Larry Luck
Making it Easy to “Trade The Moves”
A certain genre of Exchange Traded Funds (ETFs) represent industry groups like Energy, Financial, Biotech, etc. These ETFs are great vehicles because they embody the phenomenon of “group rotation” with the safety of diversification. For example, the Energy Group ETF, “XLE” represents a weighted portfolio of energy stocks. So, Why not analyze the “consensus” of the components of the ETF to determine whether it is likely to appreciate?
Consensus Trading is all about evaluating the constituents of an ETF. When most are turning up, the probability of a continued upside move on the group represented by the ETF is high. From this observation, I invented a new indicator I call, “The Leading Indicator”, shown here on XLE.
The Leading Indicator makes it very easy to see how much “pressure” there is within an ETF to make it go up or down. And as you will soon discover, that information is quite valuable.
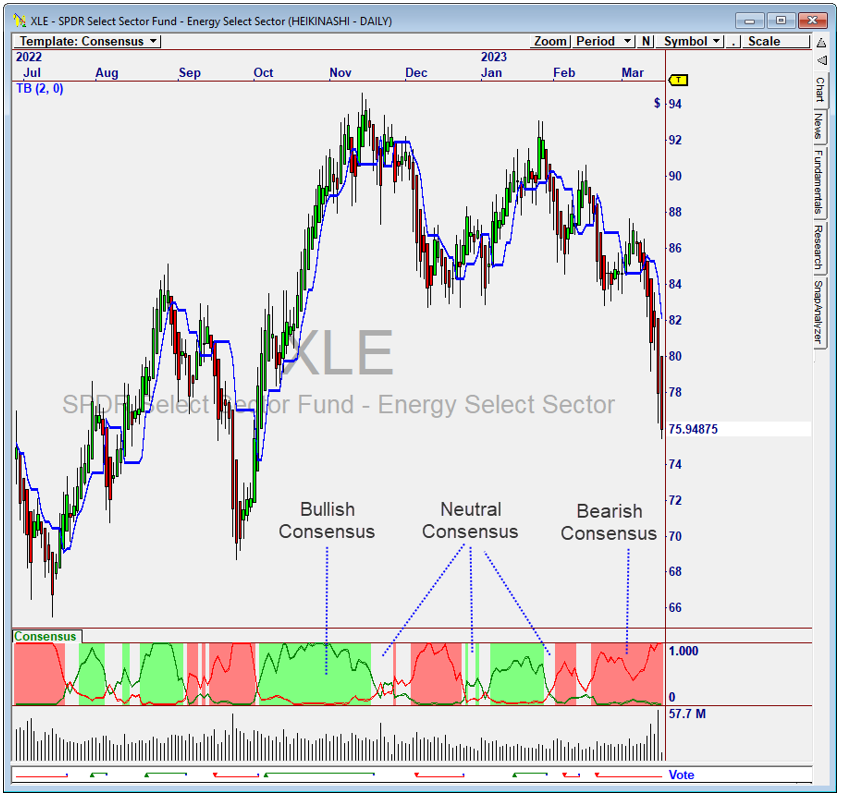
XLE (ETF) with the Leading Indicator.
Green=Bullish. Red=Bearish.
The Video of Ed's Demo on
ETF Consensus Trader is Ready!
Learn how ETF Consensus Trader makes trading ETFs
and their constituents easy, fast, and profitable.
Making it
Easy to “Trade The Moves”
A certain genre of Exchange Traded Funds (ETFs) represent industry groups like Energy, Financial, Biotech, etc. These ETFs are great vehicles because they embody the phenomenon of “group rotation” with the safety of diversification. For example, the Energy Group ETF, “XLE” represents a weighted portfolio of energy stocks. So, Why not analyze the “consensus” of the components of the ETF to determine whether it is likely to appreciate?
Consensus Trading is all about evaluating the constituents of an ETF. When most are turning up, the probability of a continued upside move on the group represented by the ETF is high. From this observation, I invented a new indicator I call, “The Leading Indicator”, shown here on XLE.
The Leading Indicator makes it very easy to see how much “pressure” there is within an ETF to make it go up or down. And as you will soon discover, that information is quite valuable.
XLE (ETF) with the Leading Indicator.
Green=Bullish. Red=Bearish.
“So Powerful, I filed for a U.S. Patent on it.”
Ed Downs
“So Powerful, I filed
for a U.S. Patent on it.”
Ed Downs
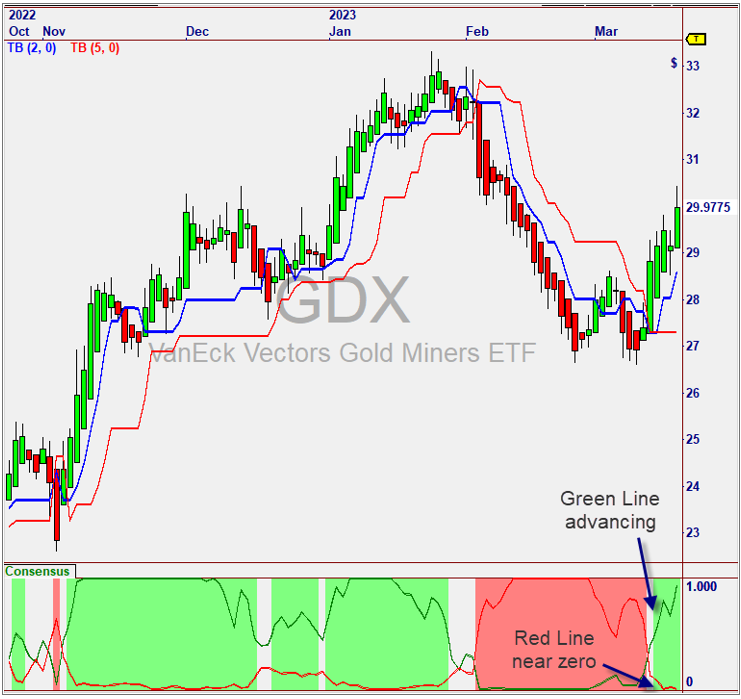
The Leading Indicator Powers It
The Leading Indicator is a new invention that measures the weighted, COMBINED movement of all stocks in an ETF after determining which ones are going up, and which are going down.
A Green Line shows Positive movement, and a Red Line shows Negative movement. I call it the “Leading Indicator” because these two lines show the trend within the ETF, and this trend typically leads a new move – up or down.
When the Positive Movement is increasing and the Negative Movement is decreasing – and especially if the Negative Movement is close to zero - a bullish move in the ETF is almost always underway. A Color Chart clearly shows the Bullish and Bearish zones (see chart). Back in 2006, we released a product called Group Trader, which was based on counting Signals on the Components of an ETF.
While this was a good concept, using the weighted contribution of each ETF Component provides a much better indication of future movement. Let’s talk about how weighting is used to make ECT a highly predictive tool for Group Rotation.
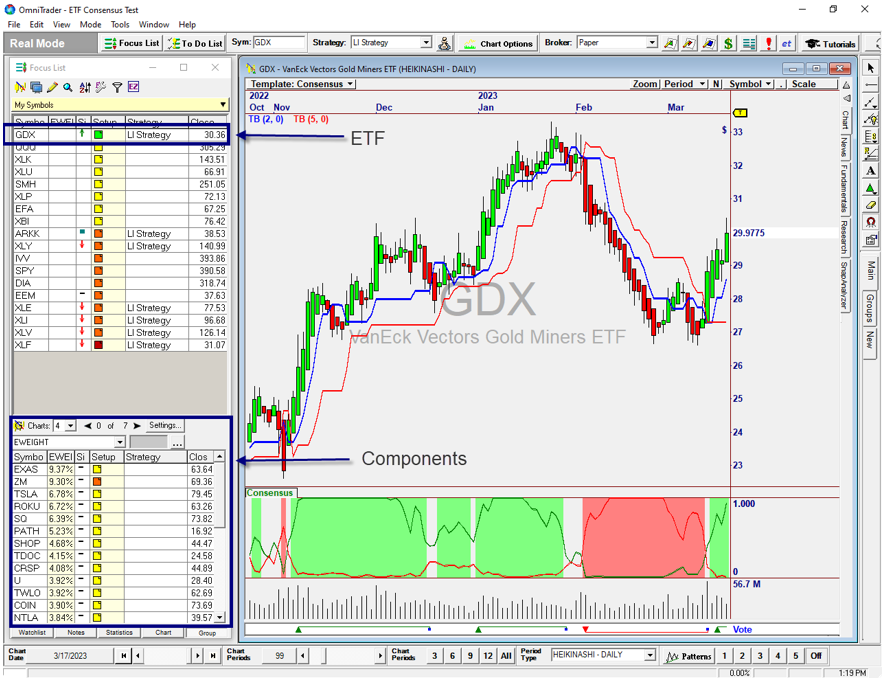
ETF Components by weight are shown in the lower list when any ETF is selected.
Component Weights + Movement Determine the “Pressure” on each ETF
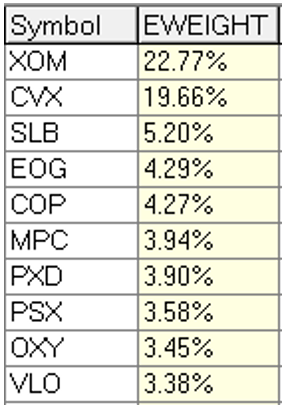
The Energy Sector ETF, “XLE” has the top 10 components shown to the right, with the weights shown. The weights are important because each ETF contains the same percentage of a given stock. The Leading Indicator uses them to determine the net “pressure” on the ETF, up or down, based on how much each individual component is represented in the ETF.
If you subscribe to Zack’s fundamentals through OmniData, the weights in each ETF are automatically updated. But you can also define them in a file like “XLE.csv”. More ETFs can be added by creating more files, as the weights are commonly published. Starter files are included. An inexpensive subscription to Zack’s is the best option, so you always have up-to-date weights.
The Leading
Indicator Powers It
The Leading Indicator is a new invention that measures the weighted, COMBINED movement of all stocks in an ETF after determining which ones are going up, and which are going down.
A Green Line shows Positive movement, and a Red Line shows Negative movement. I call it the “Leading Indicator” because these two lines show the trend within the ETF, and this trend typically leads a new move – up or down.
When the Positive Movement is increasing and the Negative Movement is decreasing – and especially if the Negative Movement is close to zero - a bullish move in the ETF is almost always underway. A Color Chart clearly shows the Bullish and Bearish zones (see chart). Back in 2006, we released a product called Group Trader, which was based on counting Signals on the Components of an ETF.
While this was a good concept, using the weighted contribution of each ETF Component provides a much better indication of future movement. Let’s talk about how weighting is used to make ECT a highly predictive tool for Group Rotation.
ETF Components by weight are
shown in the lower list when
any ETF is selected.
Component Weights + Movement Determine the “Pressure” on each ETF
The Energy Sector ETF, “XLE” has the top 10 components shown to the right, with the weights shown. The weights are important because each ETF contains the same percentage of a given stock. The Leading Indicator uses them to determine the net “pressure” on the ETF, up or down, based on how much each individual component is represented in the ETF.
If you subscribe to Zack’s fundamentals through OmniData, the weights in each ETF are automatically updated. But you can also define them in a file like “XLE.csv”. More ETFs can be added by creating more files, as the weights are commonly published. Starter files are included. An inexpensive subscription to Zack’s is the best option, so you always have up-to-date weights.
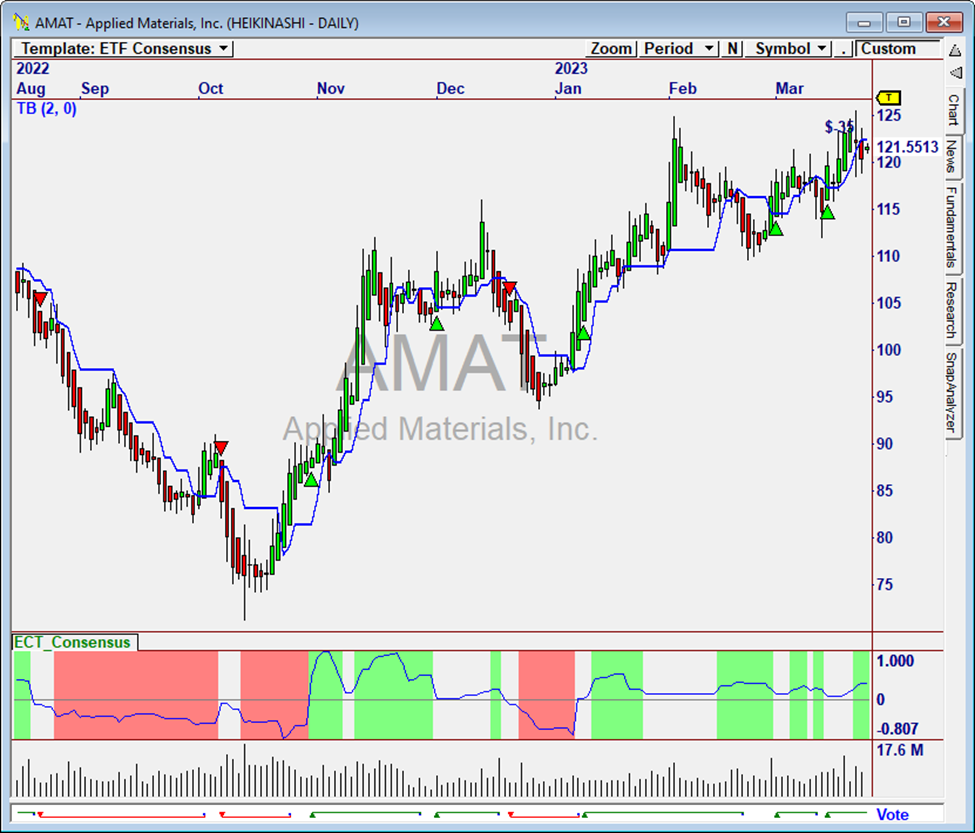
Avoid the "Muddle Zones"
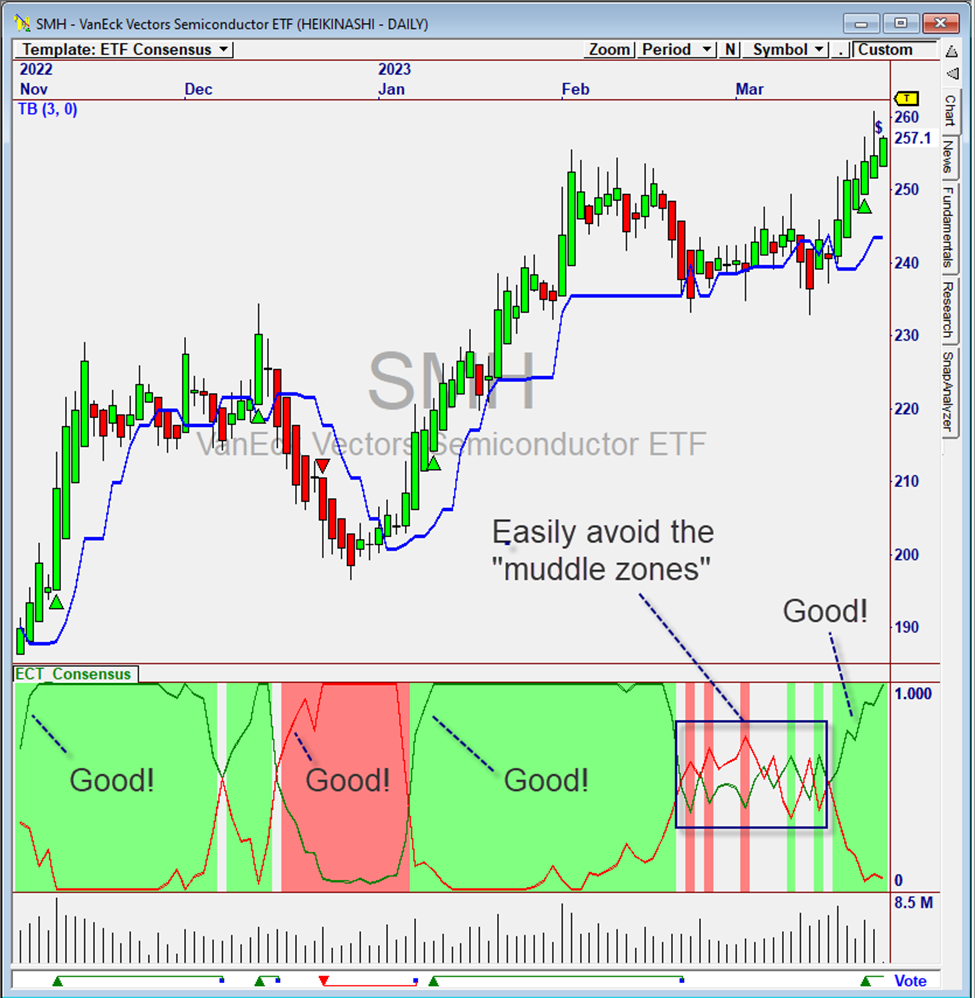
How often have you traded on a promising setup to only have it fizzle? The Leading Indicator can see the trend INSIDE the ETF, thereby determining how strong the move is. When the Green or Red Leading Indicator is strongly advancing (and the opposite is declining) you know the vast majority of most-highly weighted stocks in the ETF are moving up (or down). This helps you avoid the "muddle zones" as clearly shown on this example of the SMH, the Semiconductor Group ETF.
Avoid the
"Muddle Zones"
How often have you traded on a promising setup to only have it fizzle? The Leading Indicator can see the trend INSIDE the ETF, thereby determining how strong the move is. When the Green or Red Leading Indicator is strongly advancing (and the opposite is declining) you know the vast majority of most-highly weighted stocks in the ETF are moving up (or down). This helps you avoid the "muddle zones" as clearly shown on this example of the SMH, the Semiconductor Group ETF.
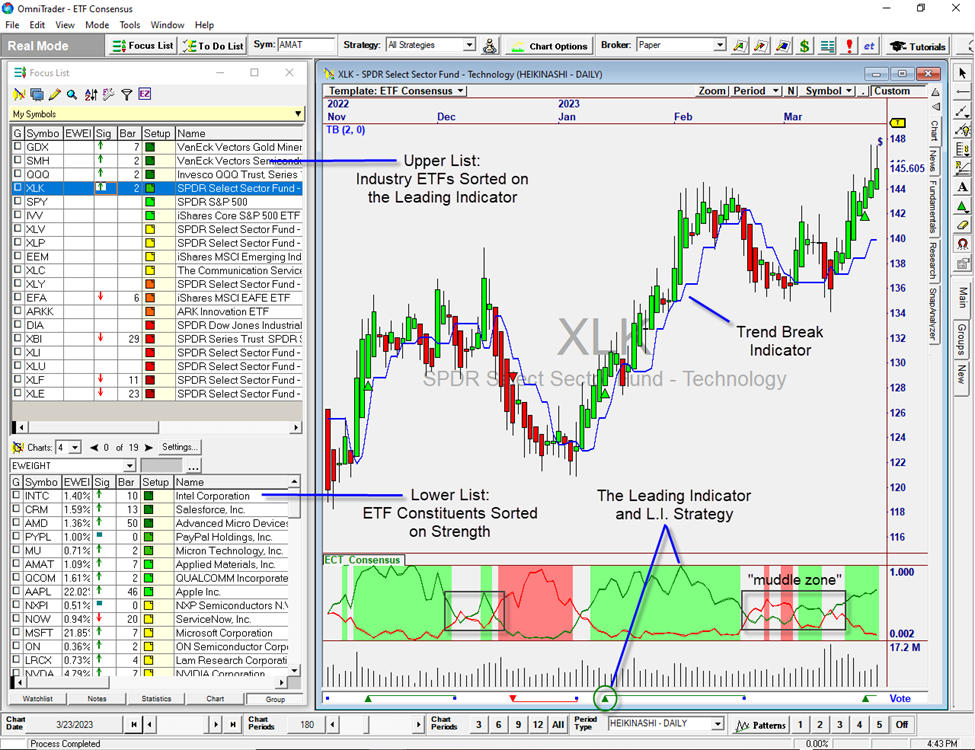
Using Consensus and Strength to Sort the Lists
In the Focus List for ECT, we use the Setup Column to make it easy to sort for the ETFs with the highest consensus, and the Components with the highest strength.
On the upper list (ETFs), the Setup Column represents Consensus. Solid Green squares identify the ETFs that have the highest (Bullish) consensus, and the Red squares show those with the most negative (Bearish) Consensus.
In the lower list (Components), the Setup Column represents Strength and Weakness in each individual stock, using the relationship between multiple Trend Break indicators. In this list, solid Green squares represent the stocks that have the largest impulse moves up, and solid Red squares indicate those that are dropping the hardest.
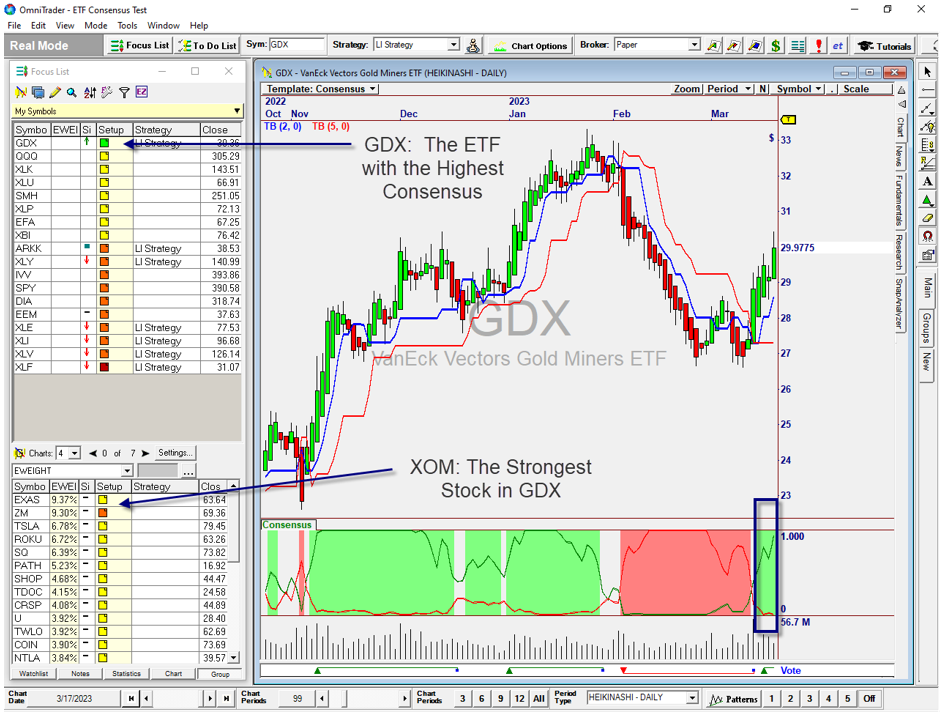
Sorting on the Setup column tells us which ETFs have the most Consensus and which Stocks within the ETFs are the strongest. From there, we can trade the best candidates from either list.
Using Consensus
and Strength to
Sort the Lists
In the Focus List for ECT, we use the Setup Column to make it easy to sort for the ETFs with the highest consensus, and the Components with the highest strength.
On the upper list (ETFs), the Setup Column represents Consensus. Solid Green squares identify the ETFs that have the highest (Bullish) consensus, and the Red squares show those with the most negative (Bearish) Consensus.
In the lower list (Components), the Setup Column represents Strength and Weakness in each individual stock, using the relationship between multiple Trend Break indicators. In this list, solid Green squares represent the stocks that have the largest impulse moves up, and solid Red squares indicate those that are dropping the hardest.
Sorting on the Setup column tells us which ETFs have the most Consensus and which Stocks within the ETFs are the strongest. From there, we can trade the best candidates from either list.
Trading Signals
A unique combination of Signals is used to provide the best Signals on each ETF and its Components. For the ETFs, we use a System based on the Leading Indicator – the Leading Indicator System. For the Components, we use one based on chart movement called The Trend Break System. Let’s talk about how these two Systems provide the best possible opportunities.
The Leading Indicator System
We see in the chart above that the Bullish and Bearish moves are indicated by separation of the Green and Red Lines. The stronger they move apart, the stronger the Signal.
For Signals on the ETFs, we measure this separation and generate a Signal when it is above a minimum threshold.
We also make sure that the lower (weaker) side is at a low value. For a Buy Signal we would want the Red Line to be as close to zero as possible while Green is strongly advancing.
When this occurs, most Symbols in the ETF are going up and almost none are going down – a recipe for a strong upside move in the ETF!
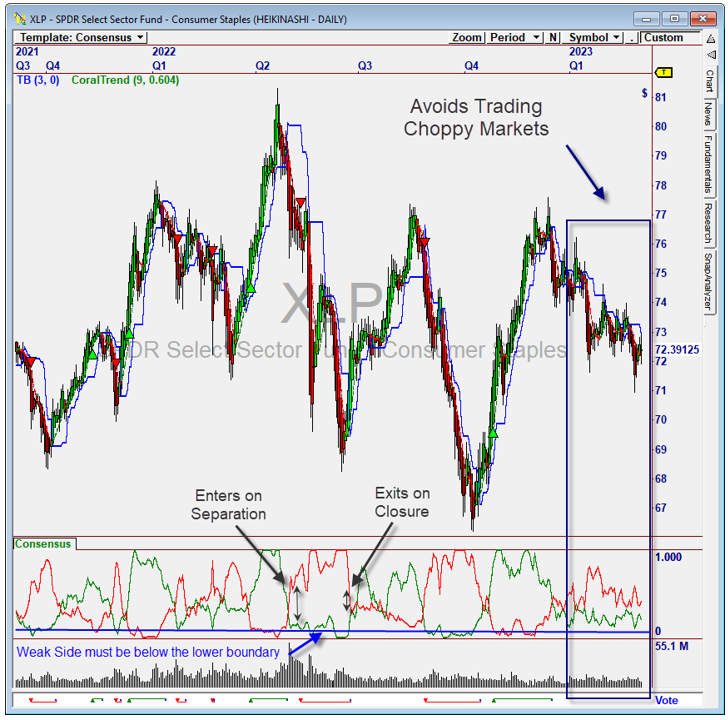
The Trend Break System
For generating Signals on the Constituents, we use the proprietary Trend Break indicator – a great addition to the ECT Plug-in.
This novel trend-following indicator is used to identify Signals when a chart transitions from “Up” to “Down” and vice versa.
The Signals enhance the Focus List view because you know that every Signal shows a significant turn in the chart. Look for the GREEN Setups with the recent GREEN Signals.
Trading Signals
A unique combination of Signals is used to provide the best Signals on each ETF and its Components. For the ETFs, we use a System based on the Leading Indicator – the Leading Indicator System. For the Components, we use one based on chart movement called The Trend Break System. Let’s talk about how these two Systems provide the best possible opportunities.
The Leading Indicator System
We see in the chart above that the Bullish and Bearish moves are indicated by separation of the Green and Red Lines. The stronger they move apart, the stronger the Signal.
For Signals on the ETFs, we measure this separation and generate a Signal when it is above a minimum threshold.
We also make sure that the lower (weaker) side is at a low value. For a Buy Signal we would want the Red Line to be as close to zero as possible while Green is strongly advancing.
When this occurs, most Symbols in the ETF are going up and almost none are going down – a recipe for a strong upside move in the ETF!
The Trend Break System
For generating Signals on the Constituents, we use the proprietary Trend Break indicator – a great addition to the ECT Plug-in.
This novel trend-following indicator is used to identify Signals when a chart transitions from “Up” to “Down” and vice versa.
The Signals enhance the Focus List view because you know that every Signal shows a significant turn in the chart. Look for the GREEN Setups with the recent GREEN Signals.
Trade the ETFs OR the
Components Within the ETFs
The easiest way to use ETF Consensus Trader is to Buy ETFs with the most Consensus among Components. However, trading the Components themselves can actually be more profitable.
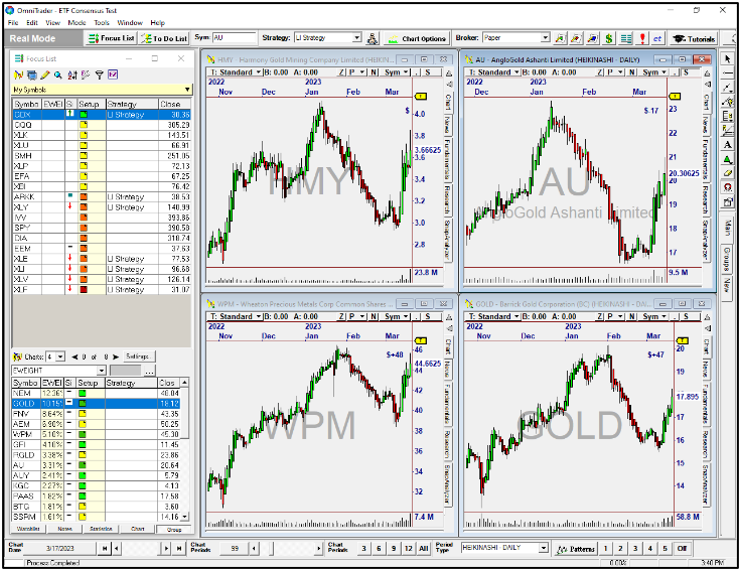
In the prior example, the GDX Gold Miner ETF is at the top of the list because it has the strongest Leading Indicator.
The Green Line indicated that most of the symbols were going up and we see very few going down. This made GDX a good ETF investment candidate.
Now, let’s look at the stocks in the lower list that are WITHIN the GDX ETF. The strongest components are HMY, AU, WPM and GOLD.
We can buy them as a confirmed “basket” or identify the one with the strongest chart. GOLD and AU have the
most room to run
This gives you a few ideas on the power of ETF Consensus Trader.
To make the process even easier, Ed is including his How-To Guide on ETF Consensus Trading, as described next.
Trade the ETFs OR the
Components Within the ETFs
The easiest way to use ETF Consensus Trader is to Buy ETFs with the most Consensus among Components. However, trading the Components themselves can actually be more profitable.
In the prior example, the GDX Gold Miner ETF is at the top of the list because it has the strongest Leading Indicator.
The Green Line indicated that most of the symbols were going up and we see very few going down. This made GDX a good ETF investment candidate.
Now, let’s look at the stocks in the lower list that are WITHIN the GDX ETF. The strongest components are HMY, AU, WPM and GOLD.
We can buy them as a confirmed “basket” or identify the one with the strongest chart. GOLD and AU have the
most room to run
This gives you a few ideas on the power of ETF Consensus Trader.
To make the process even easier, Ed is including his How-To Guide on ETF Consensus Trading, as described next.
Included:
Ed’s How-To Guide
on ETF Consensus Trading

There are several ways to use ETF Consensus Trader (“ECT”). You can trade the ETFs, Stocks within the ETFs or combinations. The Signals, Setup column, and color chart blend together to form a symphony of information that helps us effectively trade Group Rotations.
In this straightforward video, Ed demonstrates how he is using ETF Consensus Trader right now. You’ll discover how, in just 10 minutes a day, you can know which ETFs or Constituents to Buy or Sell using this amazing product.
Video topics:
• Identifying the Best Leading Indicator Setups.
• Trade the ETF or the Stocks? It depends!
• Hedging with Long and Short Candidates
• Adding your own ETFs to ETF Consensus Trader
• Other ways to customize the package
You’ll quickly agree that ETF Consensus is the easiest and most
diversified way to Trade the Moves the market gives us every day.
Included:
Ed’s How-To Guide
on ETF Consensus Trading
There are several ways to use ETF Consensus Trader (“ECT”). You can trade the ETFs, Stocks within the ETFs or combinations. The Signals, Setup column, and color chart blend together to form a symphony of information that helps us effectively trade Group Rotations.
In this straightforward video, Ed demonstrates how he is using ETF Consensus Trader right now. You’ll discover how, in just 10 minutes a day, you can know which ETFs or Constituents to Buy or Sell using this amazing product.
Video topics:
• Identifying the Best Leading Indicator Setups.
• Trade the ETF or the Stocks? It depends!
• Hedging with Long and Short Candidates
• Adding your own ETFs to ETF Consensus Trader
• Other ways to customize the package
You’ll quickly agree that ETF Consensus is the easiest and most diversified way to Trade the Moves the market gives us every day.
Investing Made Easy!
Energy
Finance
Pharma
Biotech
ETFs are excellent, diversified vehicles that take advantage of the phenomenon of group and market rotation. With ETF Consensus Trader, we can spend just a few minutes each day reviewing our positions and rotating into new ones that have more appreciation potential.
This makes it one of our easiest and most powerful trading concepts we have ever seen. And we are quite sure it will soon become one of our most popular plug-ins!
ETF Consensus Trader Includes:
• The Patent-Pending Leading Indicator and
Color Chart that brings it to life.
• Leading Indicator System for trading the ETFs
and individual ETF Components
• The Dual-Purpose Setup Column shows
Leading Indicator strength on ETFs
and Chart Strength on the Components.
• Ed’s Guide, “Trading with ETF Consensus”
ETF Consensus Trader: Powerful Yet Easy to Use!

Investing Made Easy!
Energy
Finance
Pharma
Biotech
ETFs are excellent, diversified vehicles that take advantage of the phenomenon of group and market rotation. With ETF Consensus Trader, we can spend just a few minutes each day reviewing our positions and rotating into new ones that have more appreciation potential.
This makes it one of our easiest and most powerful trading concepts we have ever seen. And we are quite sure it will soon become one of our most popular plug-ins!
ETF Consensus Trader Includes:
• The Patent-Pending Leading Indicator and Color Chart that brings it to life.
• Leading Indicator System for trading the ETFs and individual ETF Components
• The Dual-Purpose Setup Column shows Leading Indicator strength on ETFs
and Chart Strength on the Components.
• Ed’s Guide, “Trading with ETF Consensus”
ETF Consensus Trader:
Powerful Yet Easy to Use!
Need Anything? We are Happy to Help!
800-880-0338
Please feel free to contact Angela, Scott, or Nathan with any questions you might have.
Whether you are a new customer, or a long-time customer, you are important to us!
Monday - Friday, 8am to 5pm
Our software is backed by our unconditional Money Back Guarantee. If for any reason you are not fully satisfied, you may return the software, within 30 days of purchase, for a 100% refund, less shipping and handling. Texas residents add 8.25% sales tax. Educational material is non-refundable.
Important Information: Futures, options and securities trading has risk of loss and may not be suitable for all persons. No Strategy can guarantee profits or freedom from loss. Past results are not necessarily indicative of future results. These results are based on simulated or hypothetical performance results that have certain inherent limitations. Unlike an actual performance record, simulated results do not represent actual trading. There are numerous market factors, including liquidity, which cannot be fully accounted for in the preparation of hypothetical performance results all of which can adversely affect actual trading results. No representation is being made that any account will or is likely to achieve profits or losses similar to these being shown.