


Profiting from
Coral Trend!
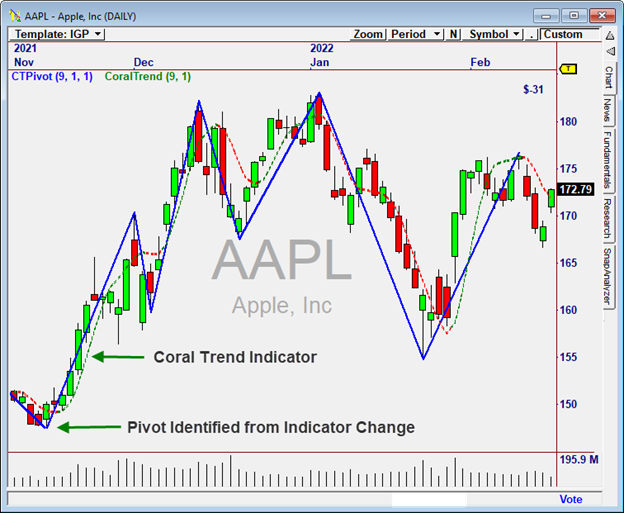
The Coral Trend indicator, introduced in OmniTrader 2022, is a very predictive indicator because of its ability to correctly forecast the beginning and end of moves.
We used the new Coral Trend Pivot indicator (CTPivot) to find the best breakout and reversal candidates the market has to offer.
Everything you need is included in the CT Trader package
Indicators
Patterns
Strategies
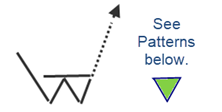
"click any image above to enlarge”
Indicators
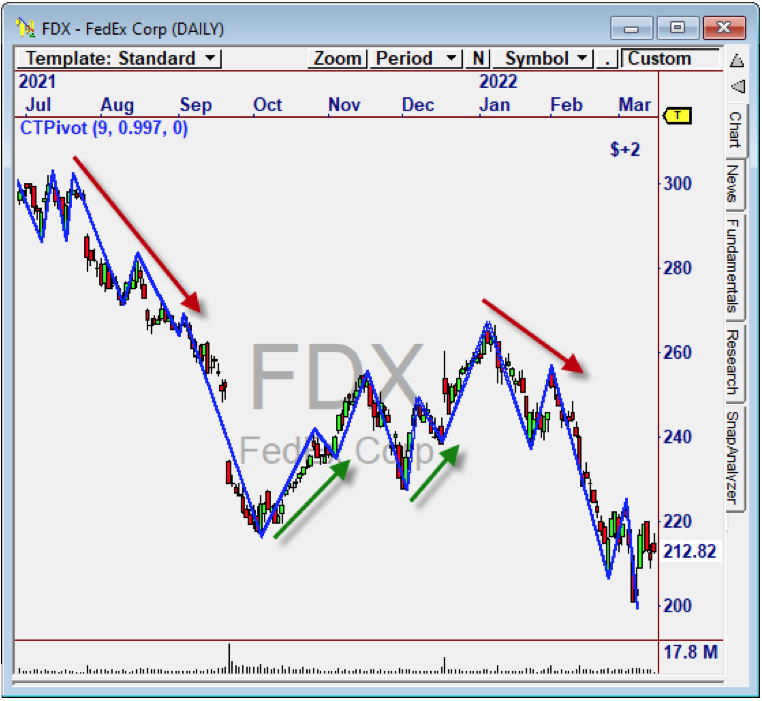
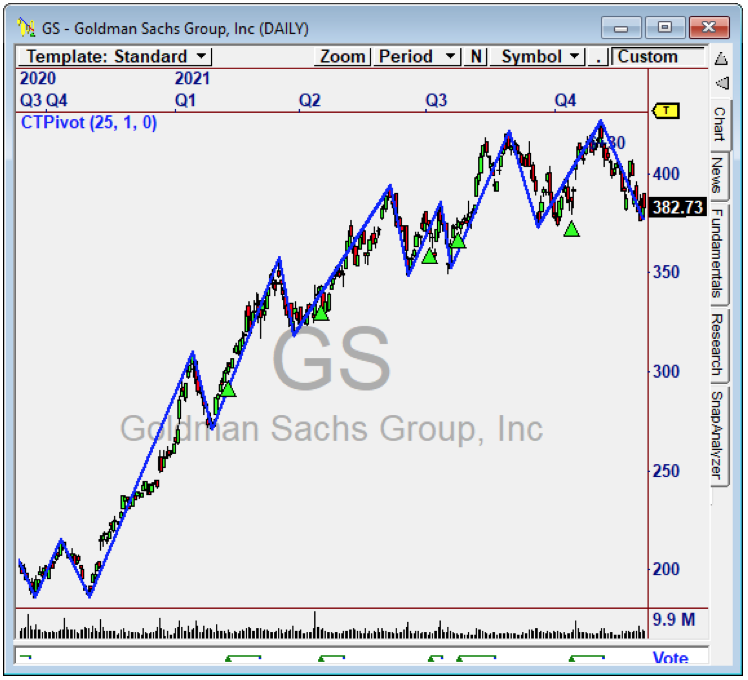
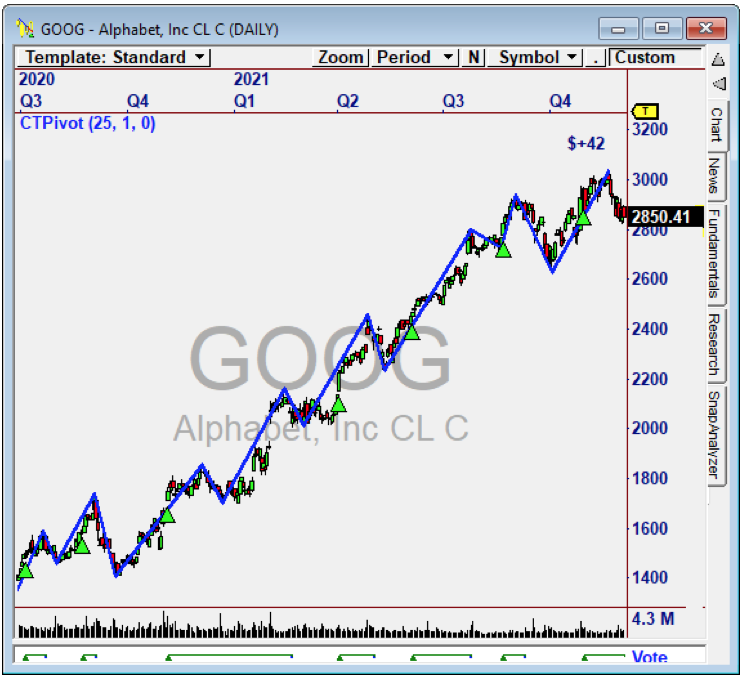
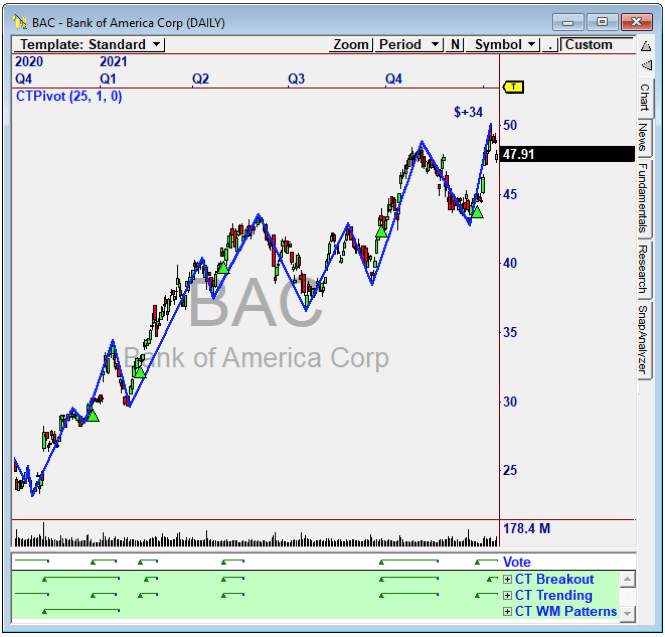
The CT Pivot Indicator
Historically, we have used Pivots based on Percentage movement (such as Zig Zag) or based on ATRs (Wave Trader). CT Pivot was created to generate faster, more predictive Pivots on which to base Reversal and Breakout trades.
Here is a chart of HD with ZigZag (pivots) and CT Pivots plotted for comparison.
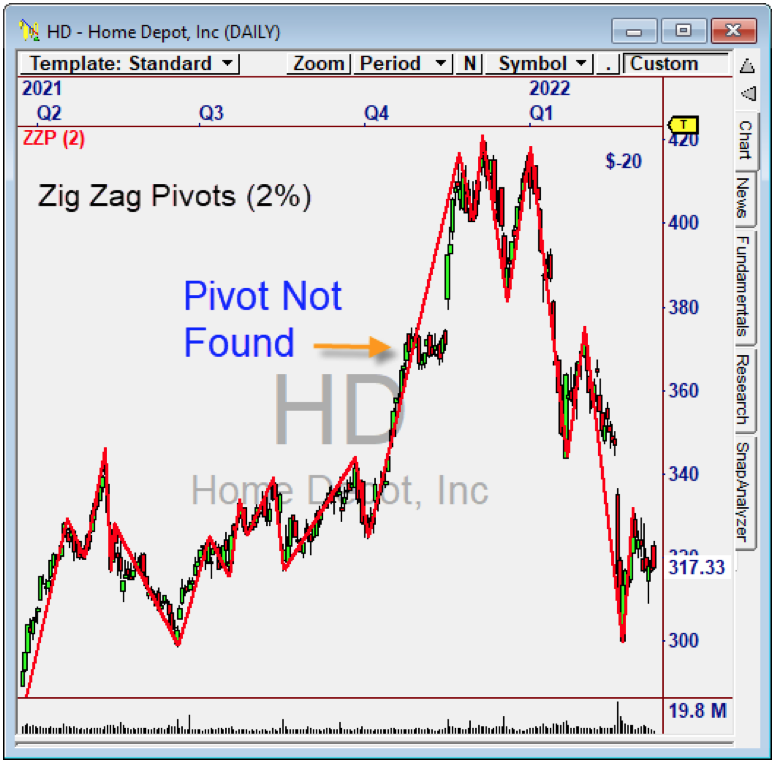
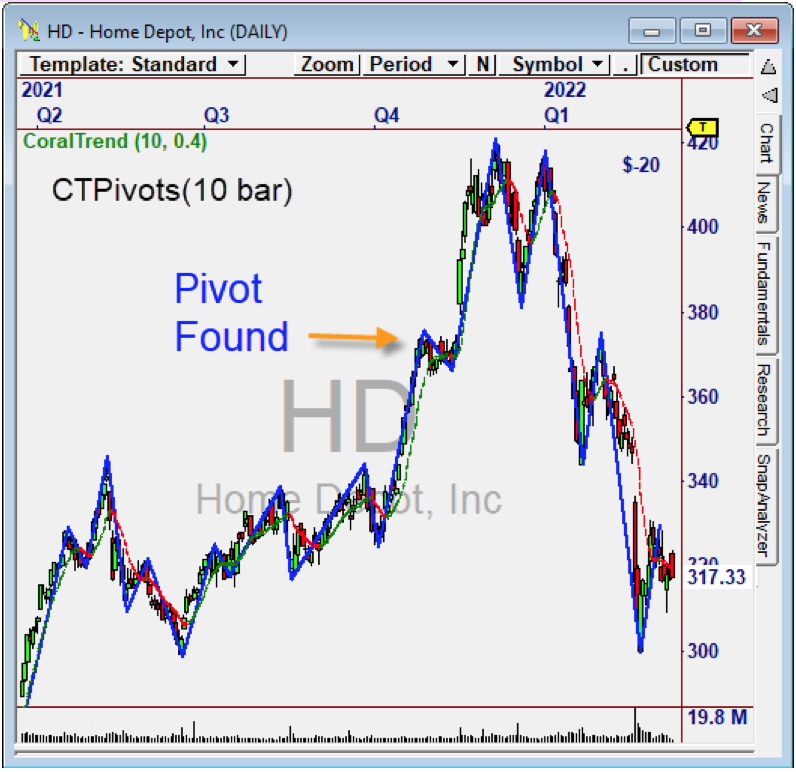
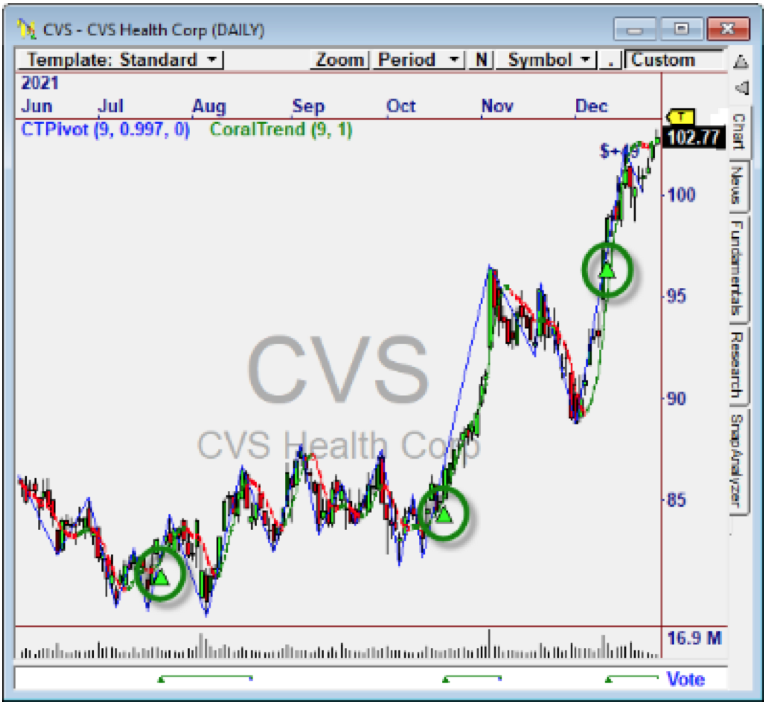
CTPivots form more quickly AND are better defined, because they follow the ebb and flow of the Coral Trend indicator as described below.
Why CT Pivots are Better:
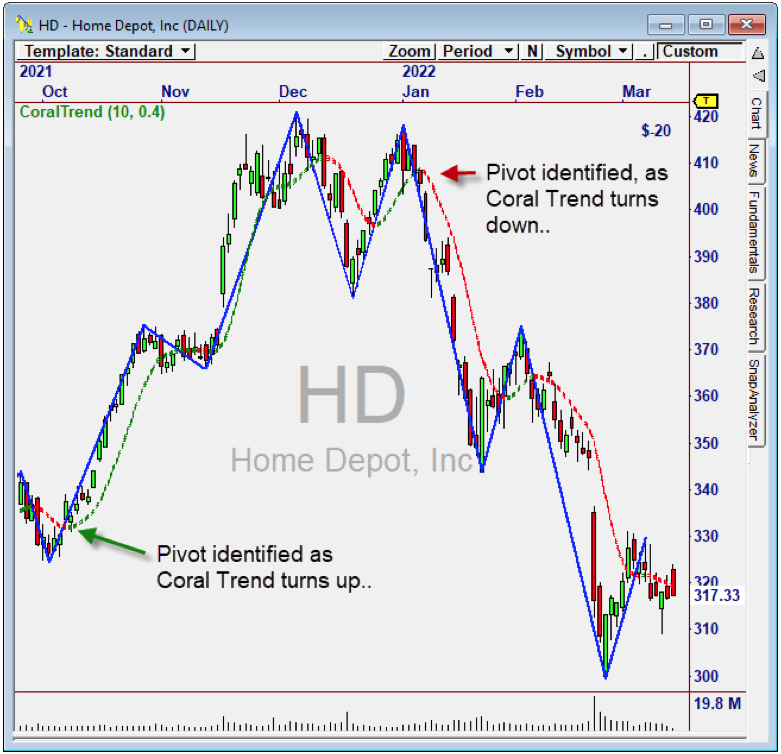
CT Pivot is based on changes in the CoralTrend indicator. When CoralTrend (for a specific Smoothing Period) turns up or down, the most recent High or Low is identified and drawn as the prior pivot.
Zig Zag pivots are often very late, because the chart has to move the given amount before they can be identified. But Coral Trend Pivots are often found more quickly because they are based on the turn in Coral Trend, not a Percent or ATR move. This makes CT Pivots ideal for any application where pivots are used.
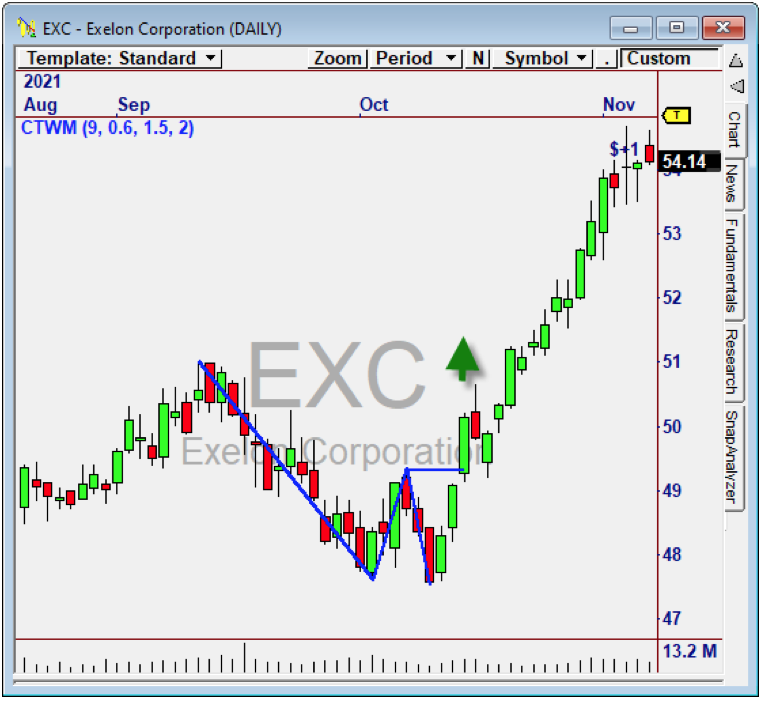
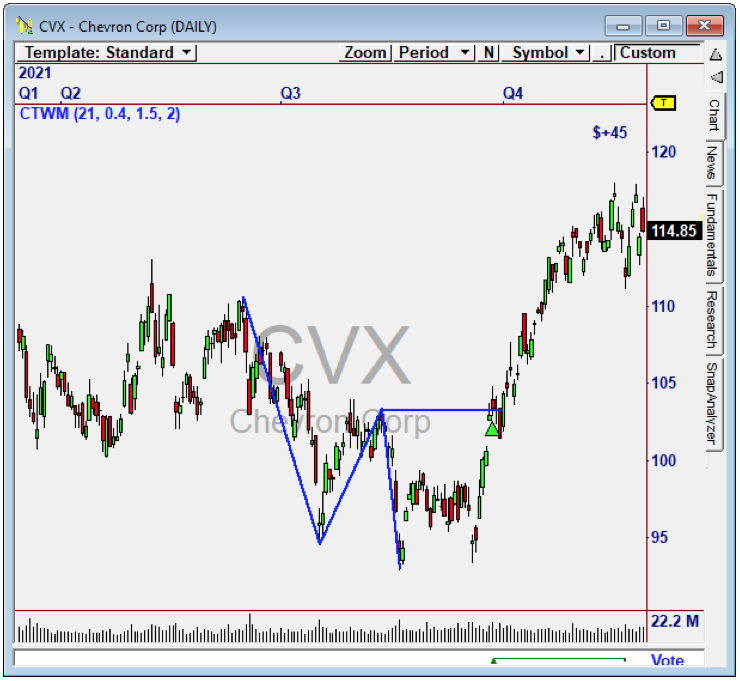
CT WM Pattern Indicator
CT Pivots help us identity patterns more in line with what your eye sees in charts, because the Coral Trend turns are much more precise. The WM Pattern is described under Patterns below.
Strategies
We Include 3 powerful Strategies Based on CT Pivot
CT WM Patterns
Uses the new W/M Pattern
(described next) to generate
explosive move Signals.
CT Trending
Using Higher Highs and Lower Low Signals, CT Trending finds strong turning points in trending markets.
CT Breakout
Uses the prior CT Pivot
to find a breakout.
Highly effective!
Patterns
The Amazing W/M Pattern
The “W” Pattern combines a Support Level with a Breakout through the center of the pattern. When well-formed, this pattern has been proven to be effective in identifying strong moves after a long decline or rally has been observed.
In the case of a “W”, when a high is formed in between support levels to form a “W” shape, a Break of high (center of the “W”) can result in an explosive move. Similarly, the “M” Pattern often identifies falling charts after a long rally into overbought territory, as shown in the example on FAST.
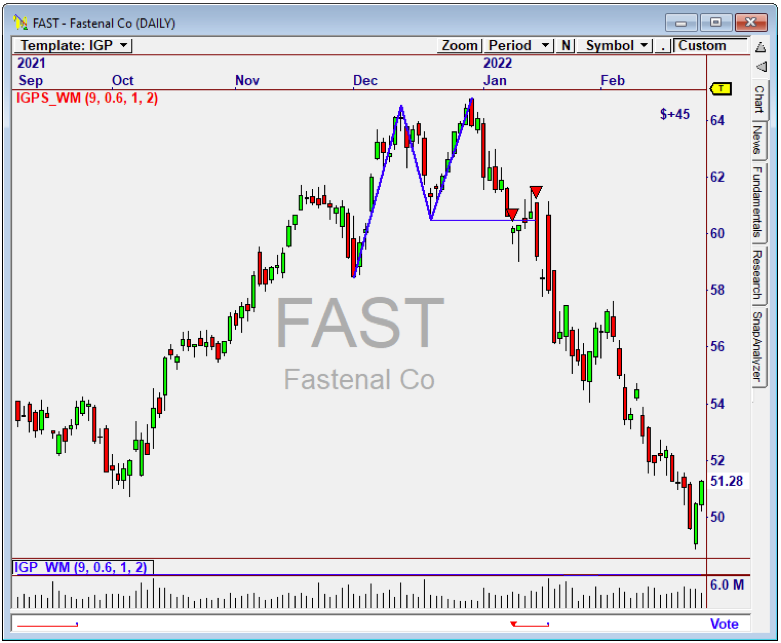
An “M” Pattern on FAST.
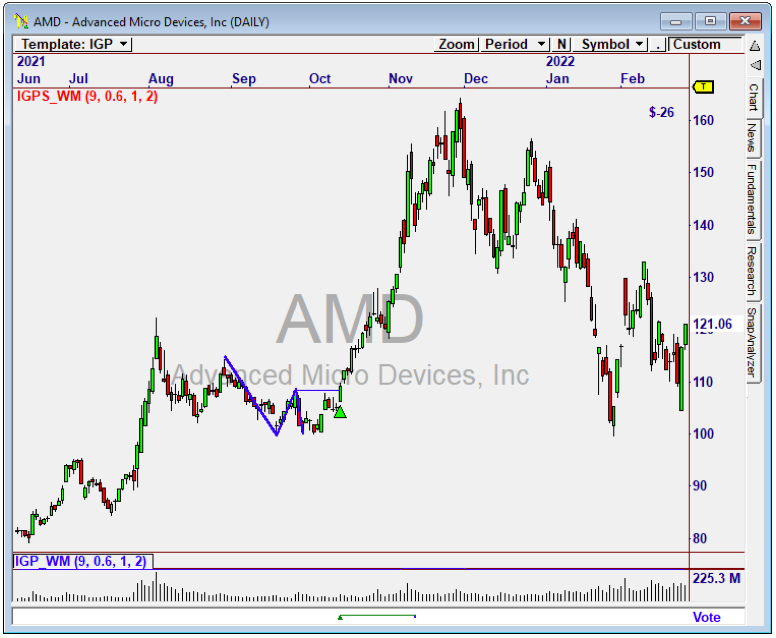
A “W” Pattern on AMD.
The WM indicator draws the patterns and a line where the break of the W or M has occurred. The indicator returns the number of bars since the pattern was found, which can be used to take measurements (such as volume) at the Break bar for added confirmation.
Identifying Today’s Most Explosive Moves
The WM Pattern Scans identify these patterns on today’s bar across the entire stock market. Here are just a few examples, based on an OmniScan performed Friday, February 25 for Monday’s market.

Two “W” Breakouts on FMX.

NEXT shows recent “M” and “W” Patterns.

AMED shows a clear “W” on the right edge.

Strong Breakout on ACC.
Performance
We recently ran our CT W/M Pattern Strategy on all stocks in the S&P 100 over the past year.
Strategies that demonstrate 80% accuracy and this high a profit number are not common!
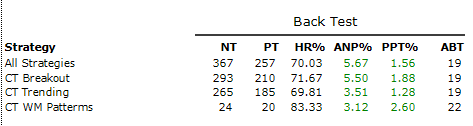
Performance report for one-year Back Test on the S&P100.
OmniScans Included!
Easily find ALL CT Trader candidates
each and every day!
CT Breakout Scan
CT Trending Scan
CT WM Patterns Scan
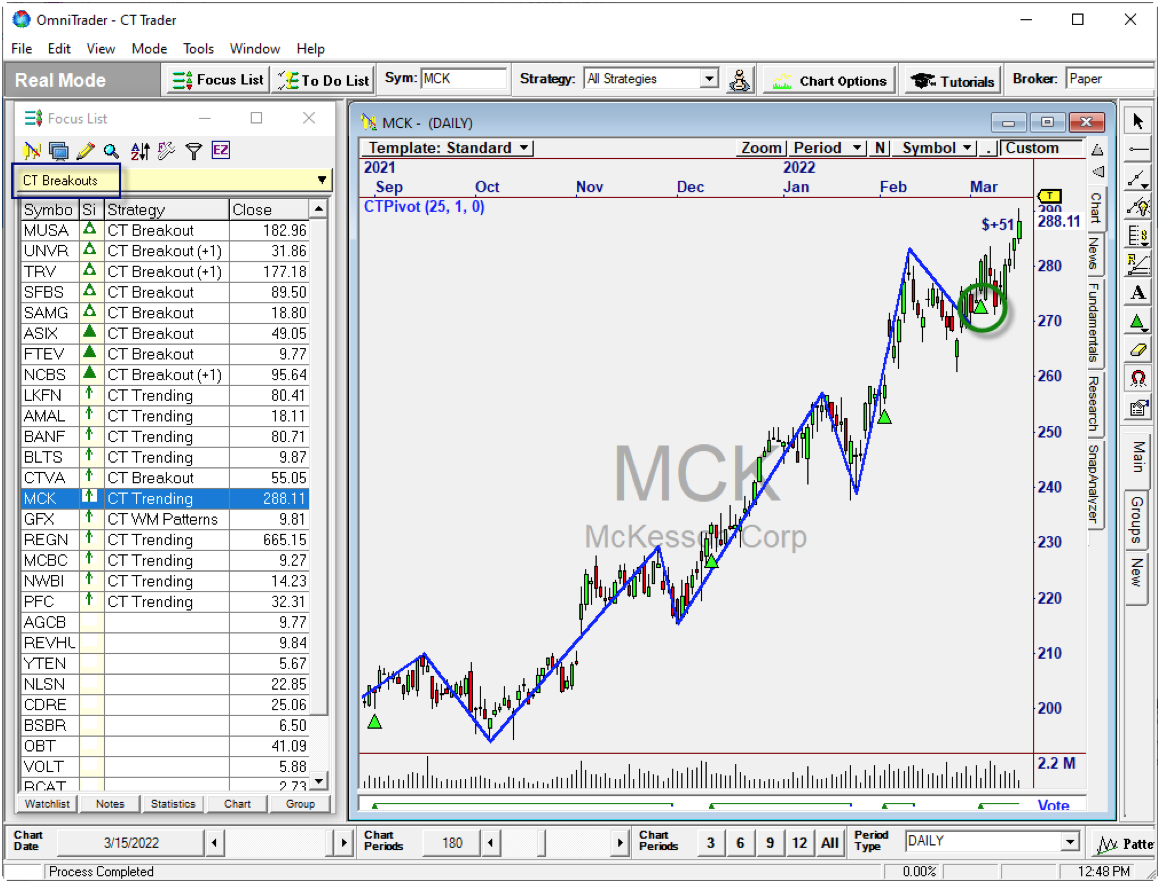
OmniScan list for CT Breakouts with McKesson selected.
PLUS! OmniLanguage Users:
Create Any Pattern You Like!
The CT Pivot indicator makes it possible to identify any pattern based on Pivots in a SINGLE LINE.
The values for P1, P2, P3, P4, and P5 come from the CT Pivot Indicator. With that, a very simple formula compares the Highs and Lows of the Pivots to identify a Triangle:
L[P1] < H[P2] and L[P1] > L[P3] and H[P4] > H[P2] and L[P5] < L[P3] and C > P2
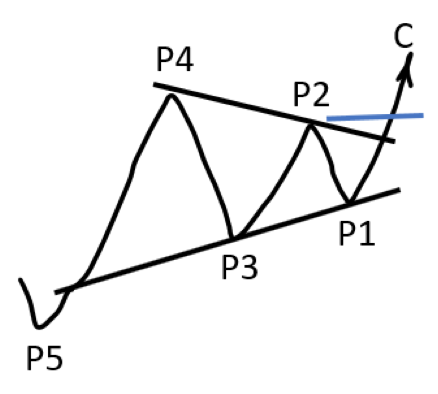
Triangle Pattern
When the above is TRUE, you have a Triangle Breakout on the right edge! Just add it to an Indicator, System, OmniScan, whatever. This is how we created the “W” and “M” Pattern. In fact, virtually any pivot relationship can be found using this technique. A simple example is provided in the CT Trader User’s Guide.
Let CT Trader
Show YOU the
Profitable Moves!
From Explosive Breakouts and Trending Signals to the WM Pattern, CT Trader is a must-have to find profitable moves in any market.
CT Trader Plug-In Includes:
CT Pivot Indicator – Helps You Easily See Precise Cycles and Pivot Patterns.
CT WM Pattern Indicator – See the Ws and Ms in Your Charts.
CT Breakout Strategy – Identifies Key Breakouts Using CT Pivots.
CT Trending Strategy – Identifies Important Chart Reversals Using CT Pivots.
CT WM Pattern Strategy – Generates Signals on the WM Patterns.
CT OmniScans – Search for CT Breakout, Trending, and Pattern
Signals Across the Entire Market.
..................................... $495
Package Summary:
• NEW CT Pivot Indicator
• NEW WM Pattern Indicator
• 3 Great Strategies
• OmniScans that Bring the Daily Candidates to You

Nirvana Club Discounts Apply
Our software is backed by our unconditional Money Back Guarantee. If for any reason you are not fully satisfied, you may return the software, within 30 days of purchase, for a 100% refund, less shipping and handling. Texas residents add 8.25% sales tax. Educational material is non-refundable.
Important Information: Futures, options and securities trading has risk of loss and may not be suitable for all persons. No Strategy can guarantee profits or freedom from loss. Past results are not necessarily indicative of future results. These results are based on simulated or hypothetical performance results that have certain inherent limitations. Unlike an actual performance record, simulated results do not represent actual trading. There are numerous market factors, including liquidity, which cannot be fully accounted for in the preparation of hypothetical performance results all of which can adversely affect actual trading results. No representation is being made that any account will or is likely to achieve profits or losses similar to these being shown.