


Connors RSI (CRSI) is a technical analysis indicator created by Larry Connors that is actually a composite of three separate components.
The Relative Strength Index (RSI), developed by J. Welles Wilder, plays an integral role in Connors RSI. In fact, Wilder's RSI is used in two of the indicator's three components.
The three components; The RSI, UpDown Length, and Rate-of-Change, combine to form a momentum oscillator.
Connors RSI outputs a value between 0 and 100, which is then used to identify short-term overbought and oversold conditions.
Connors RSI (CRSI) uses the above formula to generate a value between 0 and 100. This is primarily used to identify overbought and oversold levels. Connor's original definition of these levels is that a value over 90 should be considered overbought and a value under 10 should be considered oversold. On occasion, signals occur during slight corrections during a trend. For example, when the market is in an uptrend, Connors RSI might generate short term sell signals. When the market is in a downtrend, Connors RSI might generate short term buy signals.
A technical analyst should also be aware of the value of adapting or tweaking the Connor RSI. One of the issues with Connor RSI is that signals oftentimes occur early. For example, in an uptrend, a sell signal may present itself. However, the market continues to rise, thus a false signal. One potential safeguard against potential false signals would be combining the Connors RSI with additional technical analysis tools such as basic chart pattern analysis or additional indicators used to measure trend strength.
Another issue worth noting regarding the Connor RSI, is the placement of the overbought and oversold thresholds levels. For some trading instruments, the thresholds for overbought may need to be raised even higher and for oversold even lower. For example 95 and 5 respectively. These levels should generally be set after research and historical analysis. Making sure thresholds are in the proper place, should also help to cut down on false signals.
Indicator Comparison
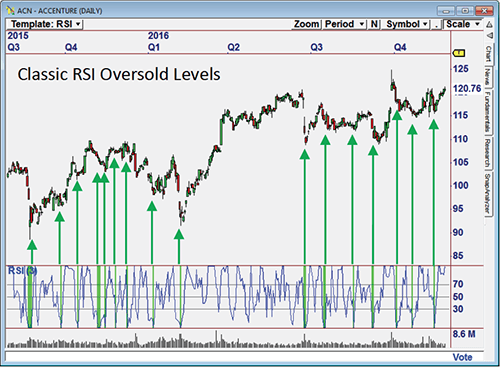
Classic (Wilder's) RSI - Oversold levels often fire "false" signals.

Connors RSI - By combining three separate indicators, oversold levels on Connor's RSI provide fewer,better trading opportunities.

Connors RSI indicator is a tool that takes a well established indicator, The Relative Strength Index (RSI) and applies it to its own theories. It can be a good way to define overbought and oversold levels and identify possible trading opportunities. That being said, Connors RSI does have a tendency to produce false signals. Therefore an astute technical analyst should experiment with what parameters work best for the security being traded. Also, combining Connors RSI with additional indicators will potentially increase its efficiency.