


Seeing the Market with Multiple Timeframe Analysis
Now Included in the Package!
With the release of MTVision in the OmniTrader 2020 Upgrade Package, our developers have been hard at work using the new technology in order to create consistently profitable Trading Strategies!
Our research has produced a gem! The MTV SuperTrend Strategy!
This strategy uses multiple higher timeframe indicators in order to determine the “SuperTrend” and the results are simply incredible.

MTV SuperTrend Show's YOU the Money!
The Results Tell the Story!
MTV SuperTrend was run on the stocks in the S&P 100 and the NASDAQ 100 for each of the last five years. It was profitable every year, with excellent results this year!

Seeing the Market with Multiple Timeframe Analysis
Seeing the Market with
Multiple Timeframe Analysis
Successful traders agree that viewing charts in higher and/or lower timeframes, other than the one you are trading can provide valuable insights into the odds of a move from the current chart position.
We can always look at multiple charts to compare timeframes. But OmniTrader 2020 makes it so much easier with Multiple Timeframe Indicators.


Visualize Success with OmniTrader 2020
and the Power of MT Analysis!
Visualize Success with OmniTrader 2020
and the Power of MT Analysis!
To start off a new decade we are delivering an OmniTrader Upgrade and Plug-in that will empower our users to clearly see the market this year and for years to come! Multiple Timeframe Analysis (MTA) is the number one approach used by professional traders to focus on the Most Profitable Trades.
To start off a new decade we are delivering an OmniTrader Upgrade and Plug-in that will empower our users to clearly see the market this year and for years to come! Multiple Timeframe Analysis (MTA) is the number one approach used by professional traders to focus on the Most Profitable Trades.
Watch this Exciting Webinar Demonstrating
the Combined Power of OmniTrader 2020
and the New MTVision Plug-in.

Watch this Exciting Webinar Demonstrating
the Combined Power of OmniTrader 2020
and the New MTVision Plug-in.

Discover the Power
of Dynamic MTA
You will learn how this addition to OmniTrader 2020 and MTVision provides OT 2020 owners with an almost unfair advantage over the rest of the market. Download our educational document today!
My Dream Come True!
My dream come true! Thanks for the implementation! I have so many stops, indicators, and systems coded that sometimes I could go and have lunch while OT complied - this is GREAT!
Features only available in OmniTrader
Dynamic Bars
OmniTrader 2020 is the
Only Software That Has It!
OmniTrader 2020 allows you to create Indicators based on other
timeframes and symbols in your charts. When a higher timeframe indicator is plotted, you can ALSO specify that it is to be calculated as a Dynamic Indicator.
As shown in the example to the right, the standard Daily value is based on the previous session. Obviously, that means there is just one value for each day.
For Dynamic Daily, we calculate the prior day’s bar on every 5 minute bar. This provides the benefit of the Daily view, with the additional benefit of capturing changes that happen in the CURRENT session!
Take another look at the charts on the right. On October 14th, Walmart reverses trend and momentum and falls throughout the trading session. The top chart showing the Daily Indicator using the previous day’s value is still showing rising momentum. But the bottom chart shows how the Dynamic Daily Indicator reacts to falling price and provides you with much more valuable information.
The benefit of this is clear when you calculate indicators dynamically. They show the effect of sudden price changes as new data is received without losing the benefit of the higher timeframe information.

Five Stars
I’d give this OT release FIVE STARS!

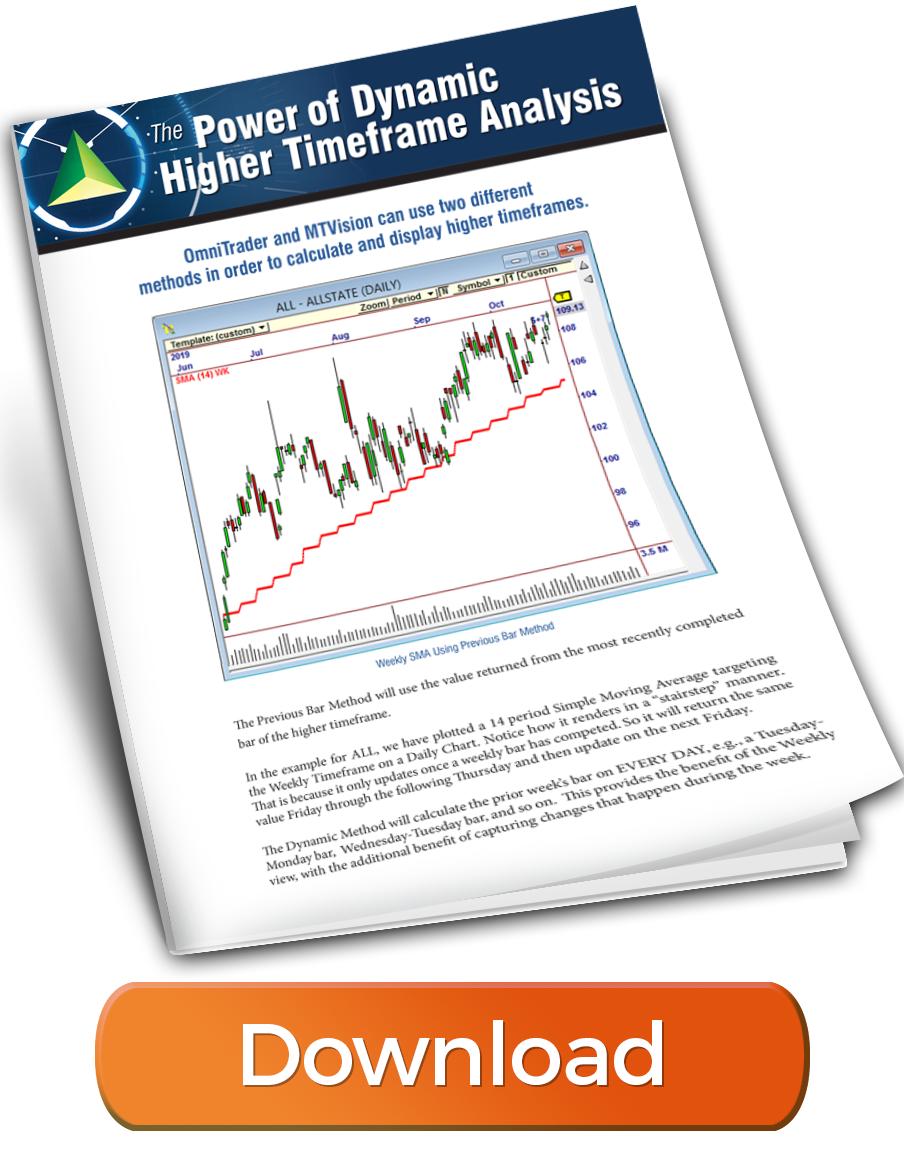
Weekly SMA Using Previous Bar Method
In the example for ALL, we have plotted a 14 period Simple Moving Average targeting the Weekly Timeframe on a Daily Chart. Notice how it renders in a “stairstep” manner. That is because it only updates once a weekly bar has completed. So it will return the same value Friday through the following Thursday and then update on the next Friday.
The Dynamic Method will calculate the prior week’s bar EVERY DAY, e.g., a Tuesday-Monday bar, Wednesday-Tuesday bar, and so on. This provides the benefit of the Weekly view, with the additional benefit of capturing changes that happen during the week.
Here is the same chart for ALL, except we changed the SMA to use the Dynamic Method. Notice it changes on a daily basis. This is because it is using 5 “virtual SMA’s” for calculation. So on Tuesday it is using the Wednesday through Tuesday SMA values, and then on Wednesday it’s using the Thursday through Wednesday SMA values, and so on.
The Dynamic Method is exclusive to Nirvana Systems and OmniTrader users. The benefit of this is clear when you calculate indicators on Dynamic Weekly, because they show the effect of sudden price changes in the middle of the week, without losing the benefit of the weekly timeframe, which is to measure general movement overtime.
However, not all indicators are conducive to the Dynamic Method. It is recommended to compare the Previous Bar and Dynamic Method indicators on your charts first to see how they appear. While most times you will see the advantage of the Dynamic Method, there are times when you will want to use the Previous Bar Method.

Weekly SMA Using Dynamic Method
Weekly SMA Using Previous Bar Method
In the example for ALL, we have plotted a 14 period Simple Moving Average targeting the Weekly Timeframe on a Daily Chart. Notice how it renders in a “stairstep” manner. That is because it only updates once a weekly bar has completed. So it will return the same value Friday through the following Thursday and then update on the next Friday.
The Dynamic Method will calculate the prior week’s bar EVERY DAY, e.g., a Tuesday-Monday bar, Wednesday-Tuesday bar, and so on. This provides the benefit of the Weekly view, with the additional benefit of capturing changes that happen during the week.
Weekly SMA Using Dynamic Method
Here is the same chart for ALL, except we changed the SMA to use the Dynamic Method. Notice it changes on a daily basis. This is because it is using 5 “virtual SMA’s” for calculation. So on Tuesday it is using the Wednesday through Tuesday SMA values, and then on Wednesday it’s using the Thursday through Wednesday SMA values, and so on.
The Dynamic Method is exclusive to Nirvana Systems and OmniTrader users. The benefit of this is clear when you calculate indicators on Dynamic Weekly, because they show the effect of sudden price changes in the middle of the week, without losing the benefit of the weekly timeframe, which is to measure general movement overtime.
However, not all indicators are conducive to the Dynamic Method. It is recommended to compare the Previous Bar and Dynamic Method indicators on your charts first to see how they appear. While most times you will see the advantage of the Dynamic Method, there are times when you will want to use the Previous Bar Method.
A World of Possibilities!
Multiple Timeframe Indicators can be used anywhere OmniScript is supported, including...
• OmniScan (See “Top-Down Analysis” below)
• Trade Plan OmniScript Stop
• Color Charts
• OmniScript FL Column
• Quick Indicator
• OmniLanguage Indicators, Systems, etc.
How do “non-programmers” benefit? We have no doubt that those who are familiar with OmniScript and these applications will share their work in our forums, as they have been doing since the Forums were opened.

Multiple Timeframe Indicators
The new Multiple Timeframe Indicators in OmniTrader 2020 opens up a world of possibilities.
Using the new MT OmniScript function in OmniTrader 2020, we can easily create an Indicator in the current timeframe based on any other indicator in another timeframe.
For example, to create a Dynamic Weekly RSI(10) to use in Daily Charts, that is simply created as:
MT(RSI(10),”W”,1)
Our first application was to create Weekly OmniScans
– a powerful addition that is churning out profitable candidates as described next!
I love the New OT!
I LOVE the new OT and the speed improvements!!! Outstanding job, everyone!
Top Down Analysis
Multiple Timeframe Indicators have made it possible to perform “Top-Down Analysis”, a powerful way to find the best possible Setups.
The DW Trending Scan finds those charts that have just started an Up-Trend in the Daily Chart when the Weekly Chart is also in an Up-Trend. Symbols you see in the Focus List will be trending up in BOTH the Daily and Weekly timeframes – the PERFECT SETUP.
Scans Included!
This is just one of the pre-defined Multiple Timeframe Scans we are including with the MTVision Plug-In.

More OmniTrader 2020 Enhancements
· Zacks Groups are Now Available by Default
· Ability to Change Width of Volume Bars (In PR2A)
· Ability to Change Width on Line and Bar Charts (In PR2A)
· Quick Indicators Now Have Everything on One Consolidated Form (In PR2A)
· Data Values Window No Longer Obscures Chart
· Ability to Plot Chart Objects Behind Price Bars
Additional OmniTrader 2020 Enhancements
Zacks Groups Available by Default
Change Width of Volume Bars
Change Width of Line and Bar Charts
Doubled Available OmniScan Historical Bars
Quick Indicators Consolidated Form
Data Values Window No Longer Obscures Chart
Plot Indicators Behind Price Bars
Added Iteration Count to Portfolio Simulation

Want to Know When to Buy, Sell or Stand Aside? Here’s How.
Want to Know When to Buy, Sell or Stand Aside? Here’s How...
MTVision INSTANTLY shows you which charts are primed to MOVE!
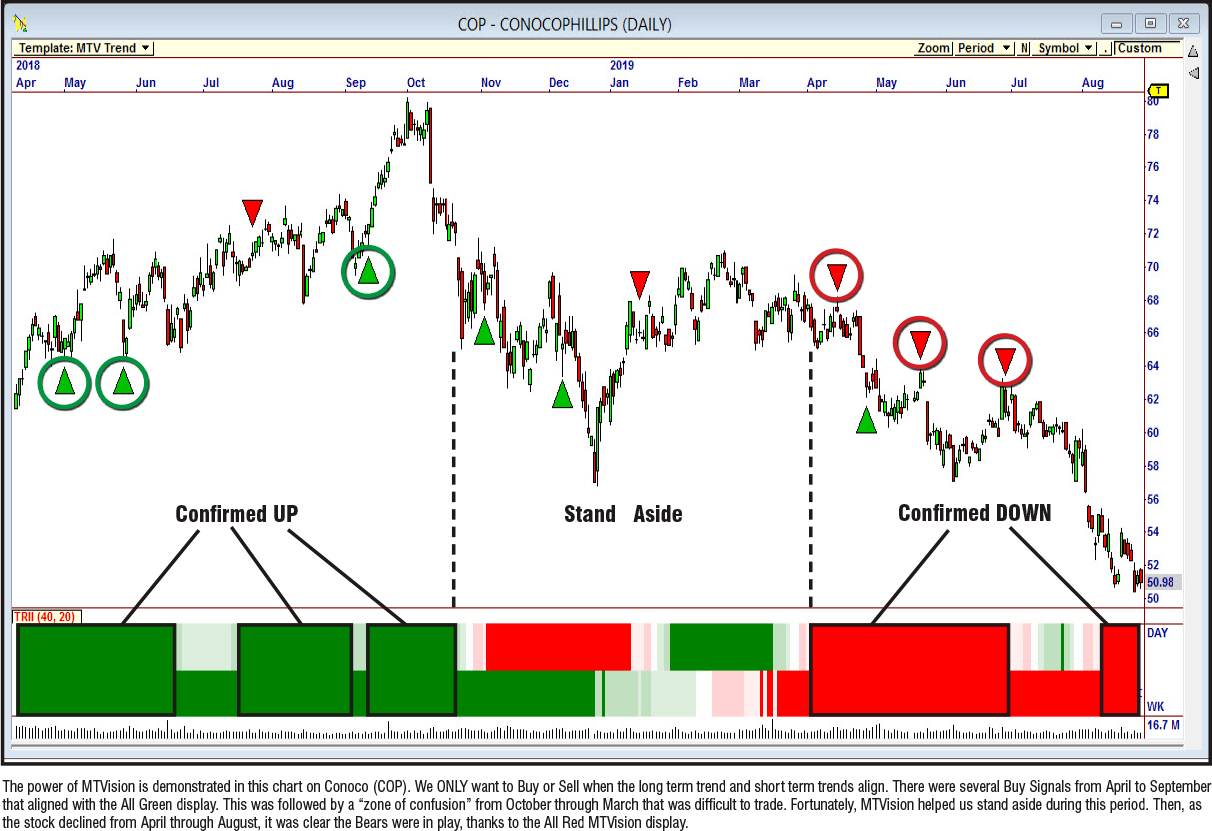
The MTVision (MTV) Plug-In leverages the Multiple Timeframe Indicator feature to create a powerful view of any market.
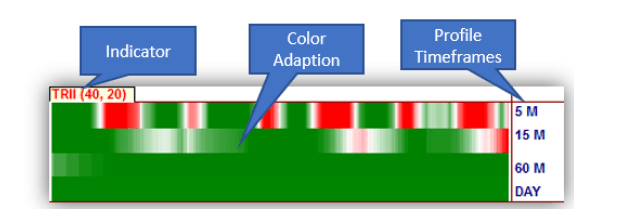
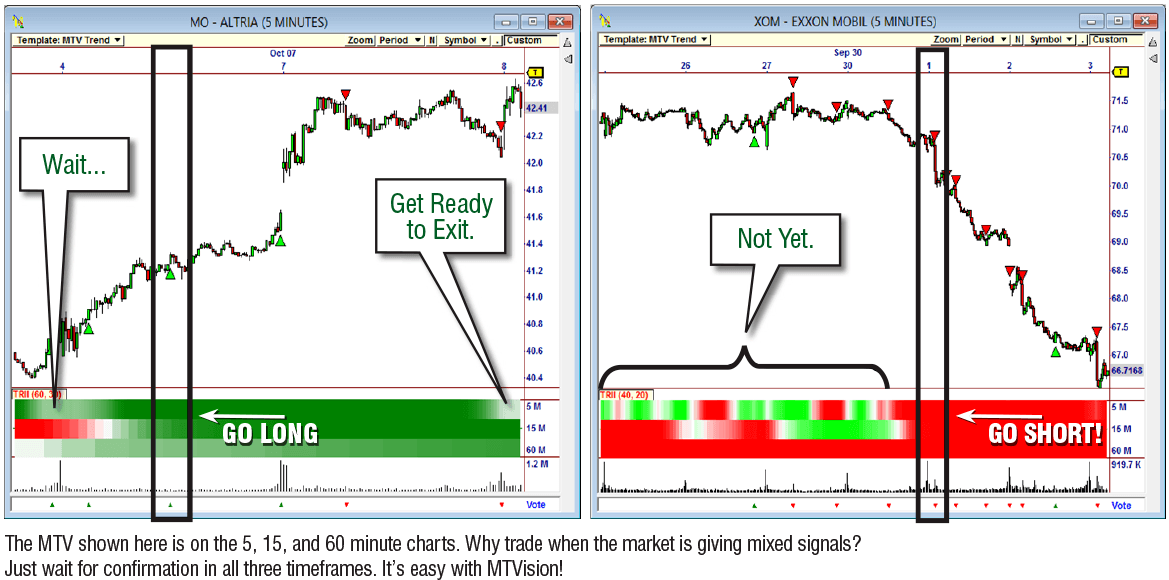
MTV displays a separate row for each timeframe in your profile, allowing you to immediately see a wealth of information in various timeframes. Confirm the trades that are poised to profit with a simple glance at the MTVision display.
MTVision also allows you to target any symbol. This means that you can instantly see things like the broad market momentum, industry group trend direction, or sector volatility.
It also allows you to plot multiple “MTV’s” at the same time, so there is no limit to the amount of information that you can instantly see in order to confirm your trades. You could easily see trend AND momentum information at the same time.
And best of all, MTVision is able to draft off of Nirvana’s proprietary Dynamic Timeframe technology, giving you a view of the market that is well beyond what is available in other software.
How it Works
Included with MTVision: Templates & Scans
We include several “canned” templates to make it easy to apply to your charts.
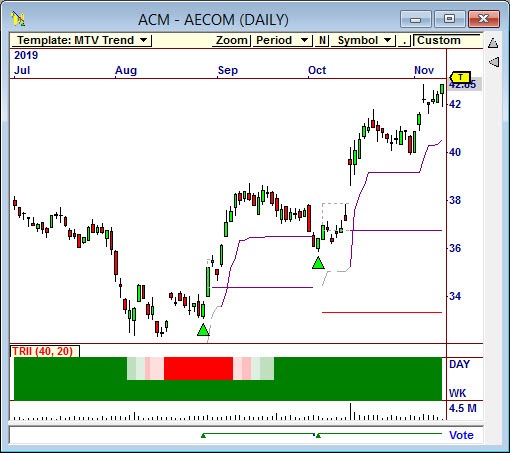
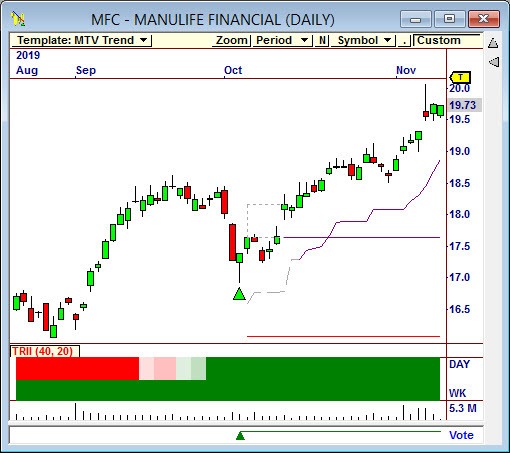
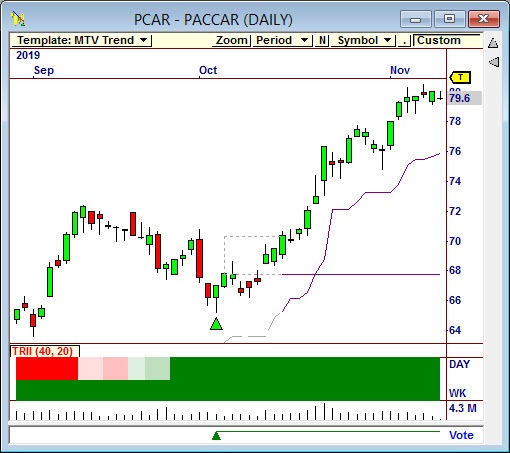
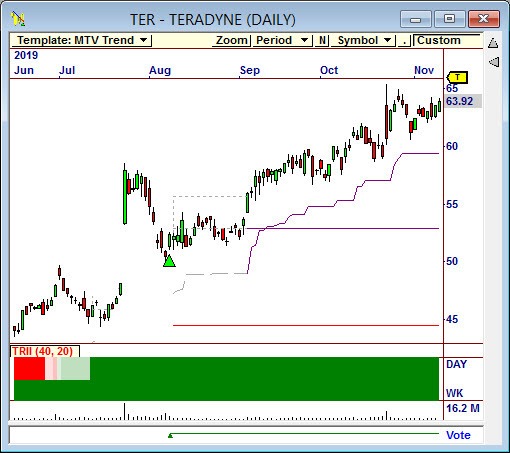
For example, the MTV Pullback in Trend Template shows you both the trend info and whether the security is overbought or oversold. The example shows an easily confirmed long signal with MTV that returned BIG profits!
Templates for Any Timeframe!
This is just one example of the templates provided in MTVision. We also include templates to help you confirm great trades in both End of Day and Real Time. Regardless of your trading timeframe, MTVision gives you templates to confirm the most profitable trades.
Never before has it been so easy to identify the best trades - and avoid the bad ones!

Included with MTVision: Templates & Scans
Provide Pre-Confirmed Candidates From the Entire Market - Right in Your Charts!
1. Pull-Backs in Trend
2. Momentum Setup
3. Bullish/Bearish Strong Trend
Once OmniScan identifies the best list each day, Chart Templates help you see precisely when to act. It’s an incredibly easy-to-use combination for profits and the PERFECT companion to MTVision!


FINALLY - Smart Compiling!
FINALLY - Smart Compiling!
by Barry Cohen, QA Department
It’s About Saving Time.
As head of the QA Department at Nirvana, the most frustrating thing I have wished could be changed is OmniTrader constantly compiling files.
In fact, there are many cases where OmniTrader will compile EVERYTHING. (With an endless “Compiling.. Compiling.. Compiling..” showing at the bottom.)
I have great news! Compiling now only occurs when it needs to on an individual file basis. If OmniTrader detects that a new file is installed or has been modified, it knows to compile only what’s needed. This improves speed in many areas including Startup!
And, when you click “Compile” in OmniLanguage it ONLY compiles what has changed! For many users this single improvement can save HOURS!
Here’s another example: Let’s say your friend gives you an OmniLanguage indicator, but it has a typo in it. This would typically cause all your OmniLanguage projects to no longer work. But no more!
Smart Compiling ensures that failed OmniLanguage files don’t affect other projects! In fact, it will continue to use the last successful compiled version!
From 20 Seconds down to TWO Seconds!
Nirvana Club Members – prepare to smile! Working with GA strategies is now an order of magnitude faster. Opening and exiting an ARM6 Strategy used to take approximately 20 seconds. In OmniTrader 2020 that same strategy opens in 2 seconds!
Thank you developers!


I’ve been an OmniTrader user for over 25 years. Like you, I have noticed behaviors here and there that I knew could be improved to make trading easier. I call them my “OmniTrader Pet Peeves!” See if you recognize any of these...
Sorting the Systems Block
When you double-click the Systems Block in a Strategy, it comes up sorted alphabetically. But what you want to see at the top are the enabled Systems. So, the initial sort is now by the Enabled column.


Finding Systems in Chart Options
This Systems tab was automatically sorted on the “short” System Names, like “RSI-C” but only the full name was visible. We now sort on the full name so you (and I) can more easily find a System in the list.
Finding Systems in Chart Options
This Systems tab was automatically sorted on the “short” System Names, like “RSI-C” but only the full name was visible. We now sort on the full name so you (and I) can more easily find a System in the list.
Important Chart Improvements
Indicators Behind Price bars!
Indicators can now display BEHIND the Price Bars so the price action is not obscured.
Move the Data Window!
Data value window does not obscure prices or indicator values. (See chart.)
Change it!
Width on Volume Bars, Bar Charts, and Line Charts is adjustable in Chart Options.
Quick Indicators!
When multiple Quick Indicators are deleted from a chart, they are also deleted from the Program. When you double-click a Quick Indicator plot, you can change line style and color.

Five Stars
I’d give this OT release FIVE STARS!


The OmniTrader 2020 Upgrade package is packed with powerful Multiple Timeframe Confirmation (MTC) Features, and we want to be sure that you can take full advantage of every one of them.
Power Your Trading with MTC is a comprehensive seminar to help you harness the profit potential of MTC. Jeff Drake will begin by looking at how other traders use MTC to consistently profit. He then looks at the BIG advantage that only OmniTrader 2020 users have – Dynamic MTC indicators.
After covering the additional MTC features in OT 2020, Jeff turns his focus to MTVision. This powerful new Plug-in for OmniTrader and VisualTrader shows a wealth of information in various timeframes.
Our complete look at MTVision includes explaining all of the settings available, the MTV Templates included, how to create your own MTVisions, and even how to use MTV to create your own indicators.
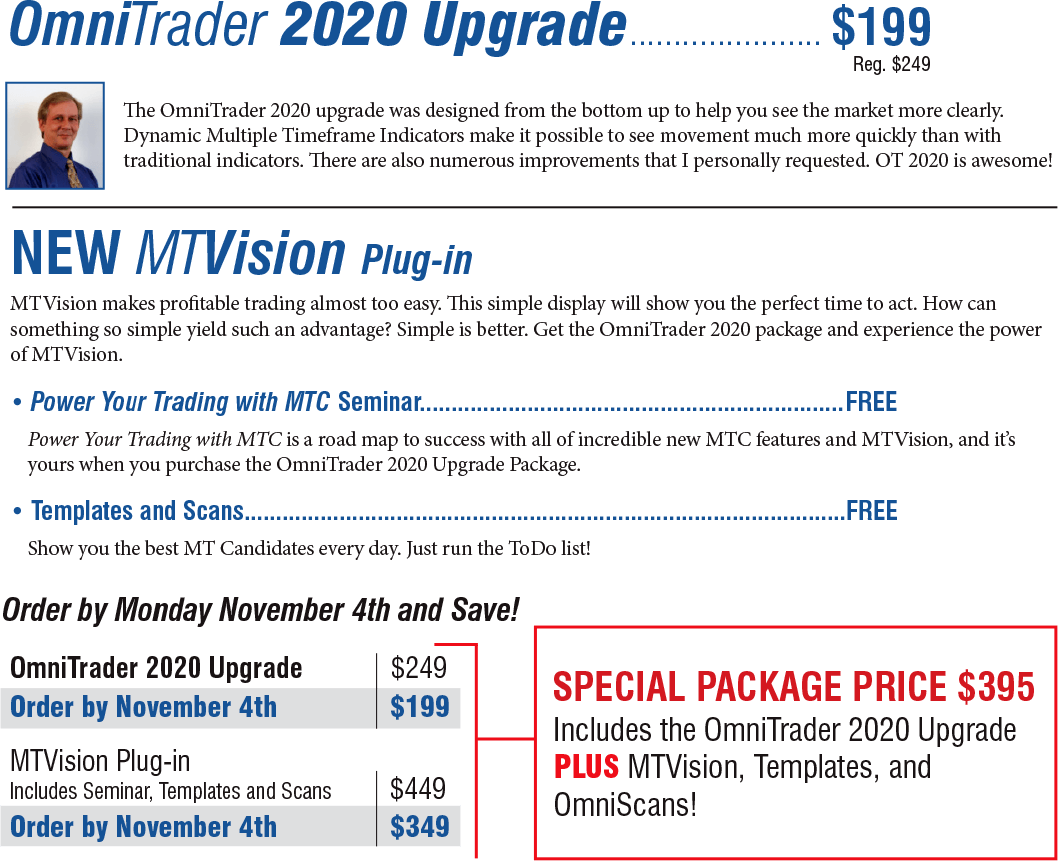
Power Your Trading with MTC is a road map to success with all of incredible new MTC features and MTVision, and it’s yours when you purchase the OmniTrader 2020 Upgrade Package.
Key Seminar Topics:
• Understanding Multiple Timeframe Analysis
• The Noise Reduction Affect
• Profiting with Dynamic MTC
• Introduction to MTVision
• Exploring the MTVision Templates
• Combining MTVisions for Success
• Creating Custom MTVisions
• Making Indicators with MTVision
Visualize Success with OmniTrader 2020

Or Call: 1-800-880-0338
Or Call: 1-800-880-0338