


Creating the “Ultimate” Indicator.
The new Connors RSI Strategy Suite is based around the concept of “blending” indicators together as published by analyst Larry Connors in his book Connors RSI 2nd Edition. In this book, Connors shows how he used the average of three different indicators, including the Relative Strength Index (RSI), in order to create a “score”. This blended indicator score has been shown to outperform the base RSI. Here’s how it works:
Connors RSI Calculation
The first component of the Connors RSI is the classic Relative Strength Index (RSI) itself. This indicator is also commonly referred to as Wilder’s RSI. The RSI can return a value of 0 to 100. Connors uses a default value of 3 Periods for his RSI Calculation.
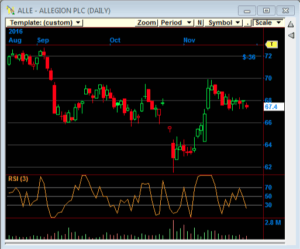
The Relative Strength Index (RSI) Plotted on ALLE
The second component of the Connors RSI is called the “streak”. This basically determines a numerical value based on the relationship of close price values. Positive numbers indicate an upward streak, and negative numbers indicator a downward streak. Here is an example as explained by Connors:
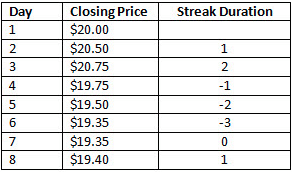
“The closing price on Day 2 is higher than on Day 1, so we have a one-day up streak. On Day 3, the price closes higher again, so we have a two-day up streak, i.e. the Streak Duration value is 2. On Day 4, the closing price falls, giving us a one-day down streak. The Streak Duration value is negative (-1) because the price movement is down, not up. The downward trend continues on Days 5 and 6, which our Streak Duration reflects with values of -2 and -3. On Day 7 the closing price is unchanged, so the Streak Duration is set to 0 indicating neither an up close nor a down close. Finally, on Day 8 the closing price rises again, bringing the Streak Duration value back to 1.”
Once the streak duration values have been determined, the RSI is applied to the streak, similar to applying RSI to price values. Connors uses a 2 period RSI by default in order to evaluate the streak.
The third component of the Connors RSI is to look at the size of the current day’s price change relative to previous price changes. This calculation is referred to as “Percent Rank”, or percentile. This tells us the percentage of values in the look-back period that are less than the current value.
So the Percent Rank is the number of values in the look back period that are less than the current value, divided by the total number of values. Again, here is an example as explained by Conners:
“For example, if the look-back period is 20 days, then we would compare today’s 2.0% return to the one-day returns from each of the previous 20 days. Let’s assume that three of those values are less than 2.0%. We would calculate Percent Rank as: Percent Rank = 3 / 20 = 0.15 = 15%”
Connors uses a default look back period of 100 bars for his Percent Rank calculation.
Now that we have all three components of the Connors RSI defined, the final calculation is to determine the average value of the three components. So we simply divide the sum of the value of the three components by three in order to arrive at the value of the Connors RSI indicator.
The Advantage of the Connors RSI
The main advantage of the Connors RSI indicator is that we are using the base RSI and two filters in order to arrive at one score. Once again, here is an explanation as provided by Larry Connors:
“When we use multiple indicators to generate an entry or exit signal, we typically set a target value for each one. The signal will only be considered valid when all the indicators exceed the target value. However, by using an average of the three component indicators, ConnorsRSI produces a blending effect that allows a strong value from one indicator to compensate for a slightly weaker value from another component. A simple example will help to clarify this.
Let’s assume that Trader A and Trader B have agreed that each of the following indicator values identify an oversold condition:
· RSI(Close,3) < 15
· RSI(Streak,2) < 10
· PercentRank(100) < 20
Trader A decides to take trades only when all three conditions are true. Trader B decides to use ConnorsRSI to generate her entry signal, and uses a value of (15 + 10 + 20) / 3 = 15 as the limit. Now assume we have a stock that displays the following values today:
· RSI(Close,3) = 10
· RSI(Streak,2) = 8
· PercentRank(100) = 21
· ConnorsRSI = (10 + 8 + 21) / 3 = 13
Trader A will not take the trade, because one of the indicators does not meet his entry criteria. However, Trader B will take this trade, because the two low RSI values make up for the slightly high PercentRank value. Since all three indicators are attempting to measure the same thing (overbought/oversold condition of the stock) by different mechanisms, it makes intuitive sense to take this “majority rules” approach.”
Our research on this approach did showed the Connors RSI was much more profitable than the basic RSI. Armed with this information, we created the Connors RSI Strategy Suite, and we decided to expand the scope of the Connors RSI even further by applying the same concept to the classic stochastic indicator as well as the Williams % R indicator. You can learn more about the Connors RSI Strategy Suite here.