or Call Us for Assistance at: 800.880.0338
The Ultimate Just Got Better:
Trade Smarter, Think Bigger, Make More!
Recently we surveyed our customers on which indicators are working the best for them in the current market. Our development team then combined their input with research we had been conducting in-house and went to work evaluating the results. And what we found out was three indicators that stood out above the rest!
We then designed The Ultimate Indicator Suite 2 to make it as easy as possible for you to get started trading with these powerful tools.
Gain a competitive edge with a complete package based on these three cutting-edge indicators and spot lucrative opportunities in today's dynamic markets!
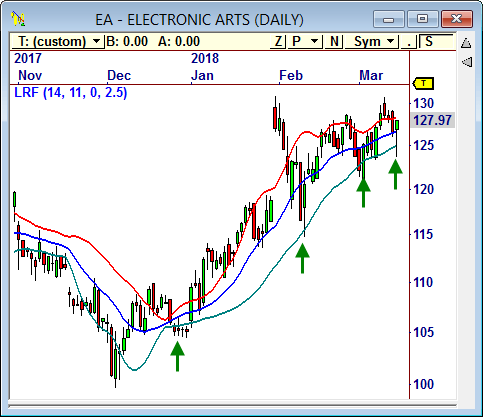


Linear Regression Forecast
The Linear Regression Forecast indicator gives you a major advantage over common trend indicators, such as moving averages, as it reacts quickly to price change, which results in less lag and better trades.
This indicator provides a “forecast” of future prices plotted on today’s data. When price is displaced from the forecast, we can expect it to return to the forecasted level. Anticipate price movements with unprecedented precision!
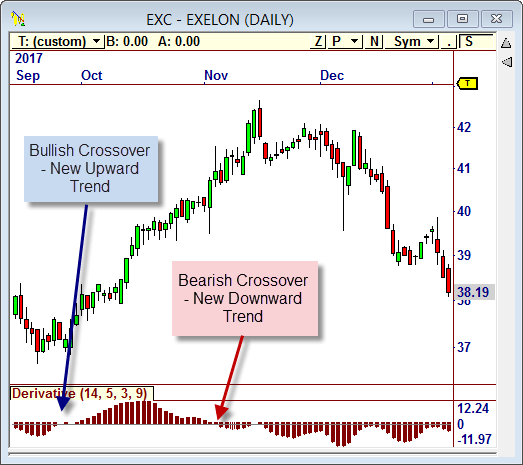


The Derivative Oscillator
The Derivative Oscillator has been widely used as one of the best confirmation tools available to traders. It combines the power of two of the most popular indicators in technical analysis into one easy to use trading powerhouse. By analyzing both momentum and trend, the Derivative Oscillator helps us determine optimal entries into new trends.
Harness the power of momentum AND trend analysis combined into one seamless tool. Stay ahead of the curve with optimal entry points into new trends.
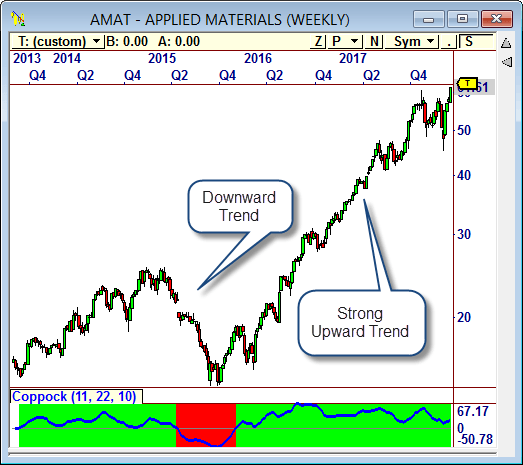


The Coppock Curve
The Coppock Curve or Coppock indicator was created for long-term investors, but it can be advantageous to any trader. The goal of this indicator is to identify long-term trend direction using monthly Moving Averages.
While there are plenty of Moving Averages to choose from, the Coppock uses an ingenious incorporation of Rate of Change indicators. Although designed to run on monthly charts, we have designed this tool so that it can be used on any timeframe - intraday, daily or weekly. Whether you're a short-term trader or a long-term investor, the Coppock Curve adapts to your needs. Identify promising buying opportunities across various timeframes with ease.
Two Powerful Strategies to Kick Start Your Trades
The Ultimate Indicator Suite 2 has two added two exceptional Trading Strategies that will help you find great trades in any market. Both strategies draft off the power of the new indicators and systems in the Ultimate Indicator Suite 2, and they use multiple timeframe confirmation to find the trades with the highest profit potential.
UIS2 Momentum Strategy
Looking for long-term growth opportunities? Look no further. The Momentum Strategy harnesses the Derivative System and the Coppock System to uncover lucrative trades with remarkable consistency.
Multiple timeframe confirmation is used to insure you are trading the primary trend, and you’ll love how this strategy delivers trades with Big Gains!
ALSO INCLUDED...
The Ultimate Indicator Suite 1
Your purchase of the The Ultimate Indicator Suite 2 includes its predecessor, The Ultimate Indicator Suite 1. This package includes some of our most popular indicators and systems!
The Hull Moving Average: In a sea of Moving Averages, one stands out as a true game-changer – the Hull Moving Average (HMA). While traditional MAs struggle with lagging behind price action, the HMA takes a quantum leap forward, offering unparalleled accuracy and responsiveness.
The Double Stochastic: When it comes to pinpointing market opportunities, accept no substitutes – the Double Stochastic reigns supreme. Handpicked as the second in our UIS 1, this powerhouse indicator combines the best features of multiple stochastic variations, culminating in a tool that's nothing short of extraordinary.
Mansfield Relative Strength: Unlock the secrets of market performance with the Mansfield Relative Strength (MRS), handpicked as the final gem in UIS 1. Originating from Stan Weinstein's acclaimed book, "Secrets for Profiting in Bull and Bear Markets," the MRS has been meticulously adapted to suit any market and timeframe, offering unparalleled flexibility and insights.


The Ultimate Indicator Suite 2 includes some of the most powerful indicators available, and profitable strategies based on these indicators. In the NEWLY UPDATED "Profiting with Ultimate Indicator Suite", Jeff Drake shows you how to use each of these tools.
In this seminar you will learn:
- How to Determine the Trend with Precision
- Which Overbought Oversold Levels Lead to higher profits
- How to Determine which stocks are beating the market
- The Trading Advantage of Each New Strategy
"Profiting with the Ultimate Indicator Suite" provides you with an informative yet concise guide to mastering these exceptional trading tools
The Ultimate Indicator Suite 2 Includes
Everything You Need to !
- 3 New powerful indicators Indicators
- 3 new Systems Based on These indicators
- 2 NEW Mechanical Strategies
- Clear and Concise Education
- PLUS! the Ultimate Indicator Suite 1
Regular Price....$495
Limited Time Special Price
ONLY $295
Upgrade From UIS1 Price
ONLY $195
Nirvana Club Discount Applies!
Nirvana Club Discounts Applied at Checkout!
or Call Us for Assistance at: 800.880.0338
Important Information: Futures, options and securities trading has risk of loss and may not be suitable for all persons. No Strategy can guarantee profits or freedom from loss. Past results are not necessarily indicative of future results. Hypothetical or simulated performance results have certain inherent limitations. Unlike an actual performance record, simulated results do no represent actual trading.


