Indicators
The Essence of the RocketTrade Method
We researched two key concepts that led us to create the Relative Strength indicators used in the Method.
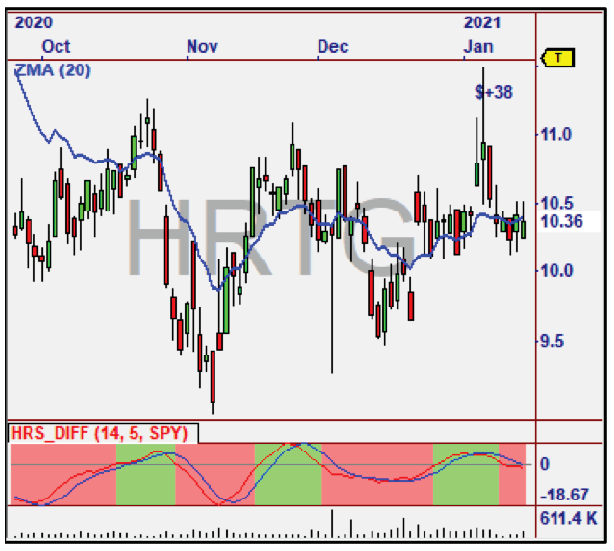
The first indicator measures the difference between the current Relative Strength and prior values of Relative Strength, and is thus called the “Difference” indicator.
The Color Chart below shows the positive (green) and negative (red) Relative Strength difference measurements. The transition between red and green indicates an increase or decrease of this measurement. The accumulation of these values is used in the Accumulation indicator (discussed next).
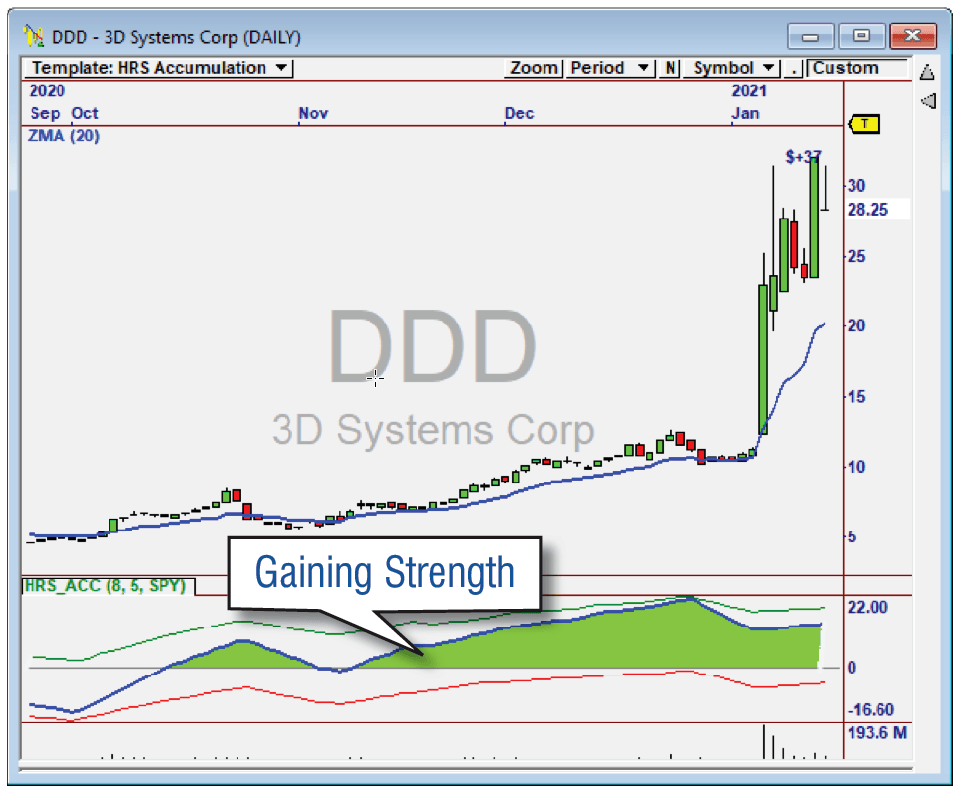
Another indicator we developed, measures the accumulation of Relative Strength and is called the “Accumulation” Indicator. It basically indicates when Relative Strength is accumulating or not, by virtue of the Blue Line being above or below zero.
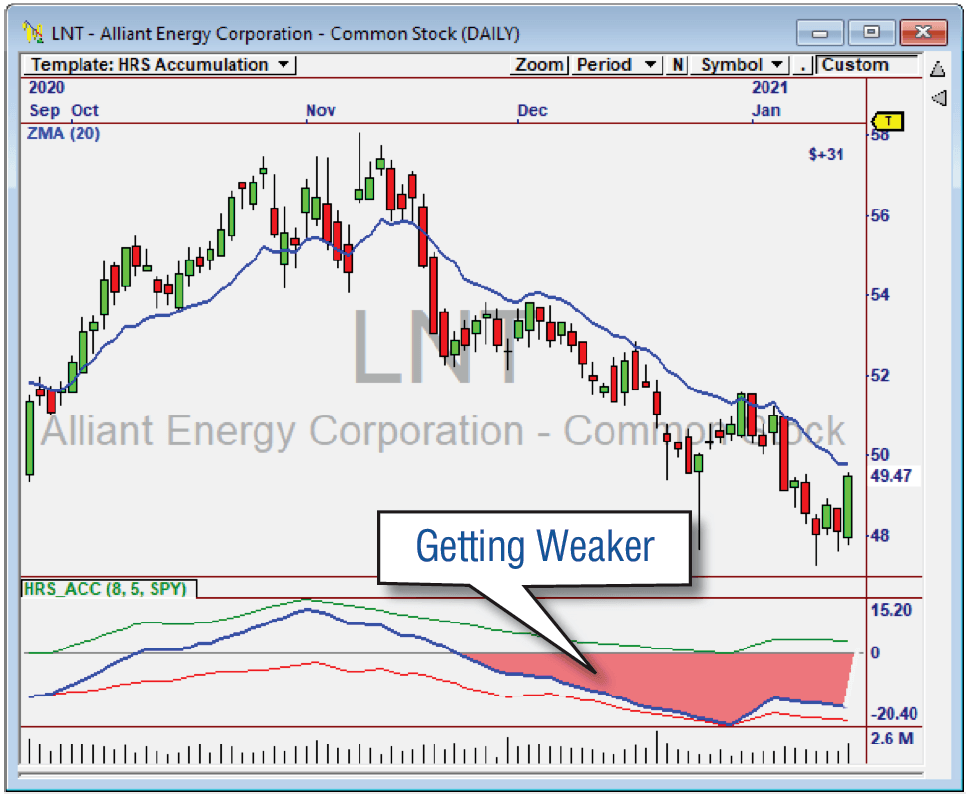
When the Blue Line is above zero for a period of time, we know the stock is in an accumulation mode, and the reverse for a distribution mode, making it easy to Scan for candidates each day.

Measuring Accumulation


In DDD, we see the Accumulation indicator trending up above zero since early November – an indication the stock would continue up.
Measuring Distribution


The Accumulation Indicator goes negative for LNT in late November, showing weakness that continued from there.